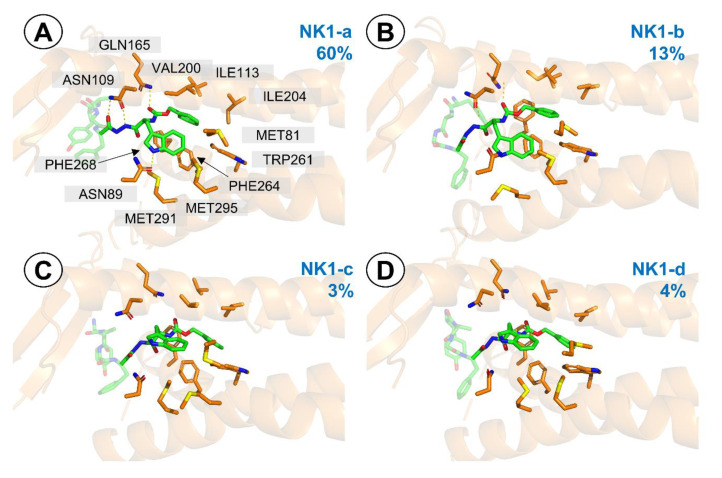
Figure 8.
Representative structures for the clusters from MD simulations of AA3266 in the NK1R binding site. Focus on the -NH-NH<-Z-D-Trp part. (A) NK1-a cluster, (B) NK1-b cluster, (C) NK1-c cluster, (D) NK1-d cluster. Only a few receptor (orange) side chains and helices are shown for clarity. The blue number is the cluster population.

