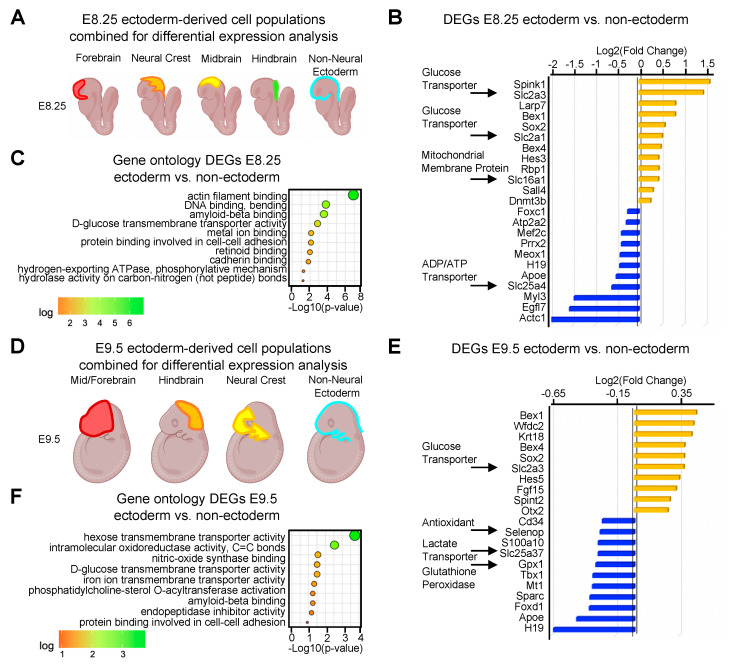
Figure 1.
Metabolism and differentiation are coupled during neurulation. (A) Differential expression of ectoderm derived cell populations grouped together and compared to the non-ectoderm-derived cells at E8.25. (B) Bar plot showing the top up- and downregulated genes at E8.25. Arrows point out metabolic genes. (C) Dot plot showing molecular gene ontology of differentially expressed genes at E8.25. (D) Differential expression of ectoderm-derived cell populations grouped together and compared to the non-ectoderm-derived cells at E9.5. (E) Bar plot showing top up- and downregulated genes at E9.5. Arrows point out metabolic genes. (F) Dot plot showing molecular gene ontology analysis of differentially expressed genes at E9.5.

