Figure 2.
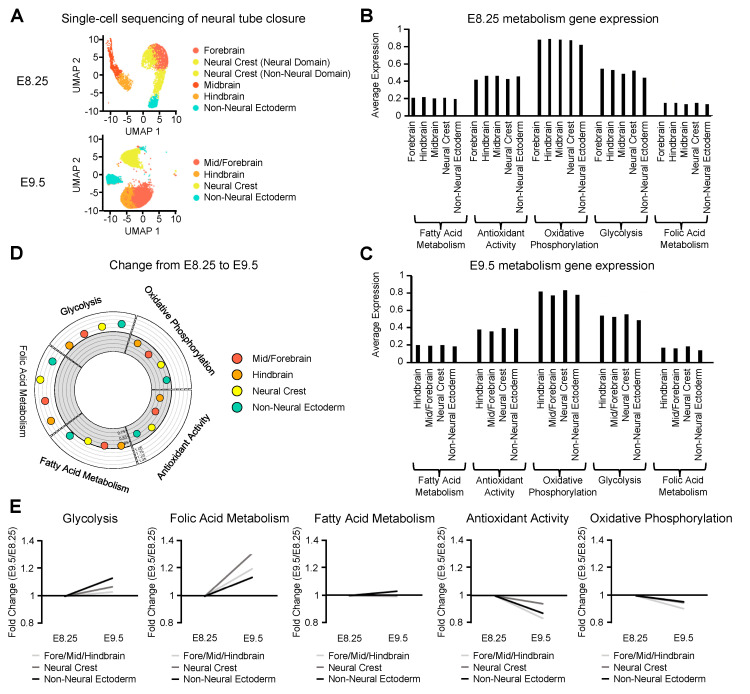
Single-cell sequencing reveals metabolic contributions to neural tube closure. (A) Uniform Manifold Approximation and Projection for Dimension Reduction (UMAP) plot showing the ectoderm-derived cell populations that contribute to neural tube closure obtained from single-cell sequencing of the cranial region at E8.25 and E9.5. (B) Bar plot showing gene expression of metabolic pathways in ectoderm-derived cell at E8.25 and (C) E9.5. (D) Circle plot showing the change in expression of metabolic pathways from E8.25 to E9.5 for each ectoderm-derived cell population. The white exterior region of the plot represents upregulation while the grey interior represents downregulation. (E) Line graphs showing change in expression for each metabolic pathway during neural tube closure in the neural tube, neural crest, and non-neural ectoderm.

