
Figure 4.
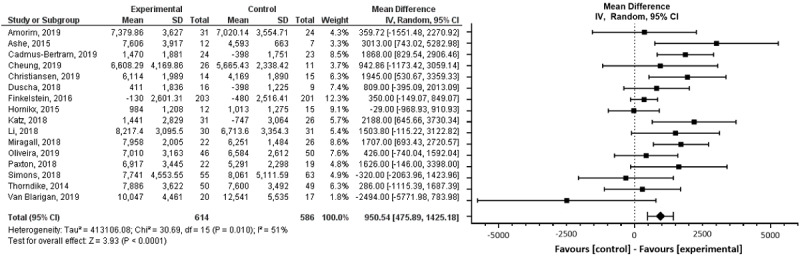
Forest plot of mean difference in steps per day in studies comparing an intervention that included a Fitbit device with a control group that did not utilize such a device.
Official websites use .gov
A
.gov website belongs to an official
government organization in the United States.
Secure .gov websites use HTTPS
A lock (
) or https:// means you've safely
connected to the .gov website. Share sensitive
information only on official, secure websites.
Forest plot of mean difference in steps per day in studies comparing an intervention that included a Fitbit device with a control group that did not utilize such a device.