
Figure 5.
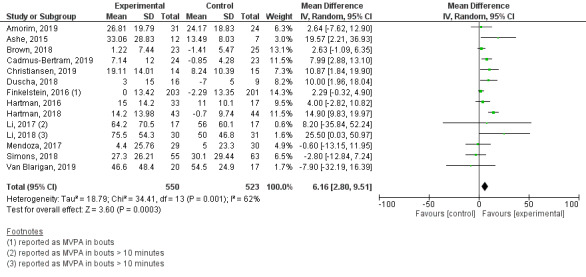
Forest plot of mean difference in moderate-to-vigorous physical activity (MVPA; min/day) in studies comparing an intervention that included a Fitbit device with a control group that did not utilize such a device.
Official websites use .gov
A
.gov website belongs to an official
government organization in the United States.
Secure .gov websites use HTTPS
A lock (
) or https:// means you've safely
connected to the .gov website. Share sensitive
information only on official, secure websites.
Forest plot of mean difference in moderate-to-vigorous physical activity (MVPA; min/day) in studies comparing an intervention that included a Fitbit device with a control group that did not utilize such a device.