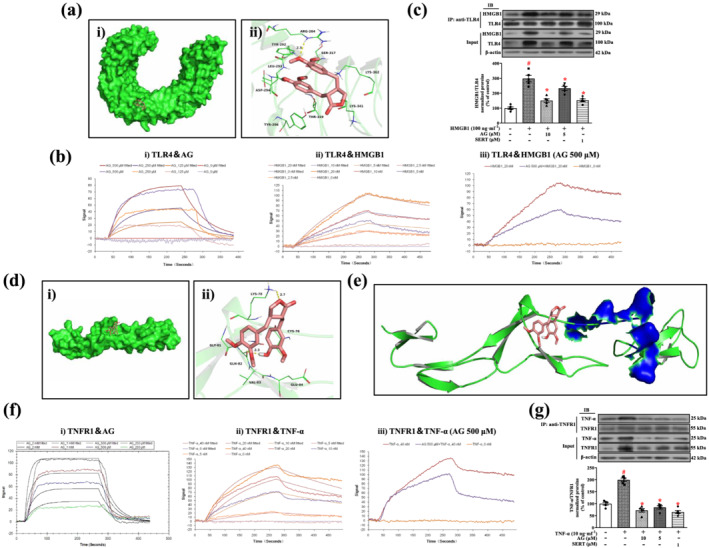
FIGURE 8.

Arctigenin disrupts the interaction between HMGB1 and TLR4 or TNF‐α and TNFR1. (a) Arctigenin docked into the binding pocket of TLR4, the total view of arctigenin (i), the detailed view of arctigenin (ii). (b) Binding affinities of arctigenin for HMGB1 and TLR4. Arctigenin (AG) directly interacts with TLR4 in a dose‐dependent manner by LSPR (i), HMGB1 directly interacts with TLR4 in a dose‐dependent manner by LSPR (ii), and arctigenin blocked the binding capacity between HMGB1 and TLR4 by LSPR (iii). (c) Primary microglia were pretreated with arctigenin (AG; 5 or 10 μM) and sertraline (SERT; 1 μM) for 12 h, followed by HMGB1 (100 ng·ml−1) stimulation for 24 h; then cell lysates were immunoprecipitated with anti‐TLR4 antibody. HMGB1 and TLR4 were detected on the western blot with anti‐HMGB1 and anti‐TLR4 antibodies after immunoprecipitation with anti‐TLR4 antibody. Western blot analysis with anti‐HMGB1 and anti‐TLR4 antibodies was performed. IP, immunoprecipitation; IB, immunoblot (n = 5). (d) Arctigenin docked into the binding pocket of the TNFR1, the total view of arctigenin (i), the detailed view of arctigenin (ii). (e) Total view of the binding mode between arctigenin and TNFR1. TNFR1 is shown as green cartoon mode. Arctigenin is shown as salmon sticks; the TNF‐α binding sites are shown in blue surface mode. (f) Binding affinities of arctigenin for TNF‐α and TNFR1. Arctigenin directly interacts with TNFR1 in a dose‐dependent manner by LSPR (i), TNF‐α directly interacts with TNFR1 in a dose‐dependent manner by LSPR (ii), and arctigenin blocked the binding capacity between TNF‐α and TNFR1, as assayed by LSPR (iii). (g) Primary microglia were pretreated with arctigenin (AG; 5 or 10 μM) and sertraline (SERT; 1 μM) for 12 h, followed by TNF‐α (10 ng·ml−1) stimulation for 24 h; then cell lysates were immunoprecipitated with anti‐TNFR1 antibody. TNF‐α and TNFR1 were detected by western blot with anti‐TNF‐α and anti‐TNFR1 antibodies after immunoprecipitation with anti‐TNFR1 antibody. Western blot analysis with anti‐TNF‐α and anti‐TNFR1 antibodies was performed. IP, immunoprecipitation; IB, immunoblot (n = 5). The data are expressed as means ± SEM. # P < 0.05, significantly different from control group; *P < 0.05, significantly different from vehicle group; △ P < 0.05, significantly different from sertraline group; one‐way ANOVA followed by post hoc Tukey's test
