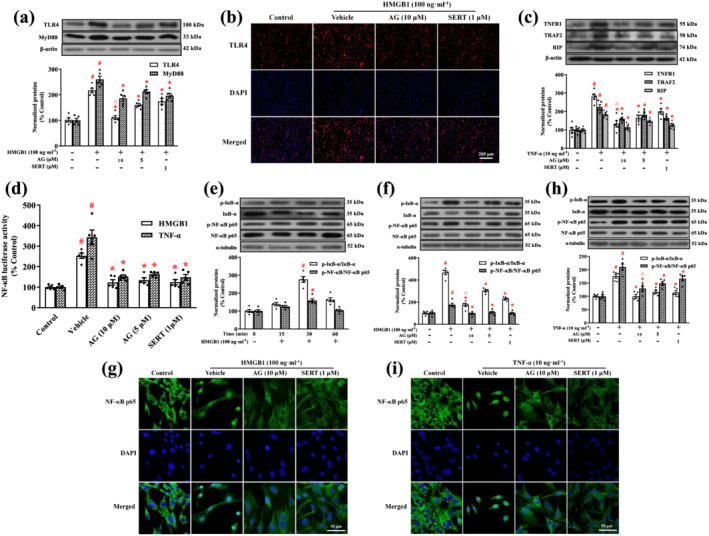
FIGURE 9.

Arctigenin inhibited HMGB1/TLR4/NF‐κB or TNF‐α/TNFR1/NF‐κB signalling pathway in HMGB1‐ or TNF‐α‐stimulated microglia. (a) Expression of TLR4 and MyD88 in HMGB1‐stimulated microglia was assessed by western blot. The protein levels were normalized to the level of β‐actin. (b) Representative immunofluorescence microscopic images showed TLR4 (red) and DAPI (blue) in HMGB1‐stimulated microglia. (c) Expression of TNFR1, TRAF2, and RIP in TNF‐α‐stimulated microglia was assessed by western blot. The protein levels were normalized to the level of β‐actin. (d) Primary microglia were transfected with an NF‐κB luciferase reporter plasmid. After 24 h of transfection, the cells were pretreated with arctigenin (AG; 10 μM) and sertraline (SERT; 1 μM) for 12 h, followed by HMGB1 (100 ng·ml−1) or TNF‐α (10 ng·ml−1) stimulation for 12 h. Luciferase activity was determined by using the Luciferase Assay System. (e) The total p‐IκB‐α and p‐NF‐κB p65 protein levels in HMGB1‐stimulated microglia were assessed for the indicated time by western blot. Each immunoreactive band of the phosphorylated protein was normalized against unphosphorylated protein. (f, h) The total p‐IκB‐α and p‐NF‐κB p65 protein levels in HMGB1‐ or TNF‐α‐stimulated microglia were assessed by western blot. Each immunoreactive band of the phosphorylated protein was normalized against unphosphorylated protein. (g, i) Representative immunofluorescence microscopic images showed NF‐κB p65 (green) and DAPI (blue) in HMGB1‐ or TNF‐α‐stimulated microglia. The data are expressed as means ± SEM (n = 5). # P < 0.05, significantly different from control group; *P < 0.05, significantly different from vehicle group; △ P < 0.05, significantly different from sertraline group; one‐way ANOVA followed by post hoc Tukey's test
