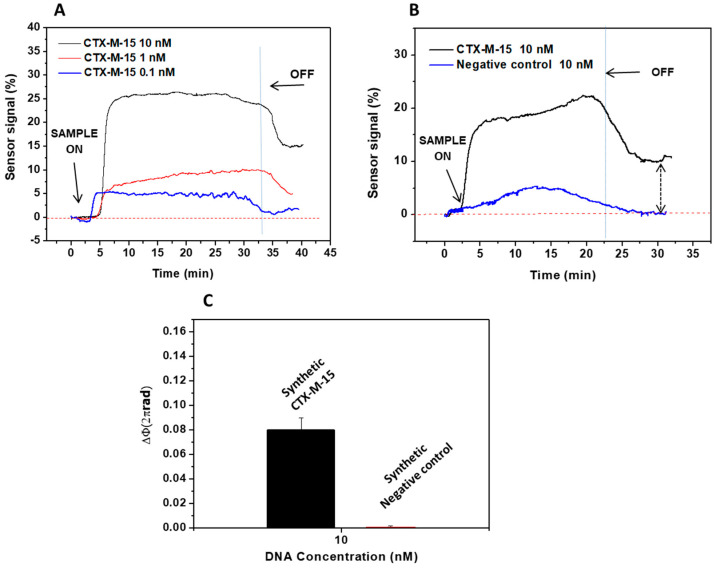
Figure 3.
Evaluation of synthetic DNA target. (A) Real-time interferometric signal obtained for the hybridization of the synthetic target (88 mer) to blaCTX-M-15 probe; (B) Real-time interferometric signals obtained for the binding of 10 nM of target (black line) and negative control (blue line) to the blaCTX-M-15; (C) Comparison of the signal of synthetic blaCTX-M-15 DNA target (10 nM) versus synthetic control target (10 nM). All measurements were done in triplicate, and the data are shown as means + SD.

