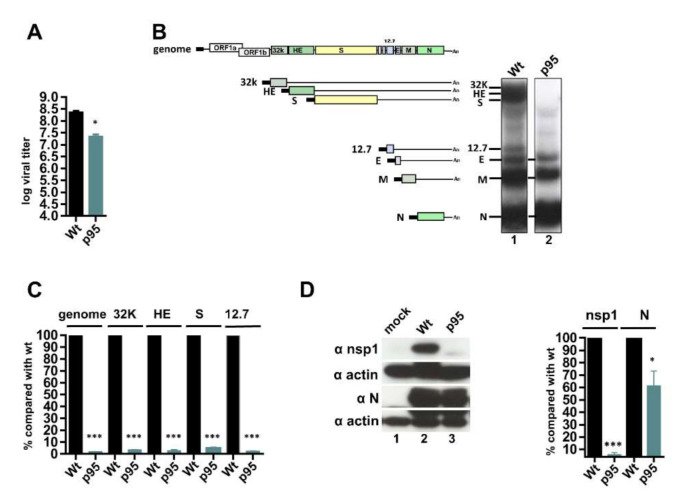
Figure 2.
Determination of gene expression efficiency for BCoV during persistence. (A) The virus titer of wt BCoV (Wt) and BCoV-p95 (p95) as determined by the plaque assay. Virus collected from fresh HRT-18 infected with wt BCoV was designated Wt. Virus collected from HRT-18 cells after 95 d of persistent infection with wt BCoV was designated BCoV-p95 (p95). (B) Left panel: Schematic representing the BCoV genome and sgmRNAs. Right panel: Synthesis of BCoV RNA as determined by Northern blotting. (C) Relative amounts of genome and subgenomes including sgmRNAs 32K, HE, S and 12.7 between Wt and p95 as measured by RT-qPCR. (D) Left panel: Coronaviral protein synthesis from the genome (represented by nsp1) and subgenome (represented by N protein) during persistence by Western blotting. Right panel: Relative amounts of nsp1 and N protein between Wt and p95 based on the results shown in the left panel. The values in (A,C,D) represent the mean ± standard deviation (SD) of three individual experiments. Statistical significance was evaluated using a t-test: * p < 0.05, *** p < 0.001.

