Figure 3.
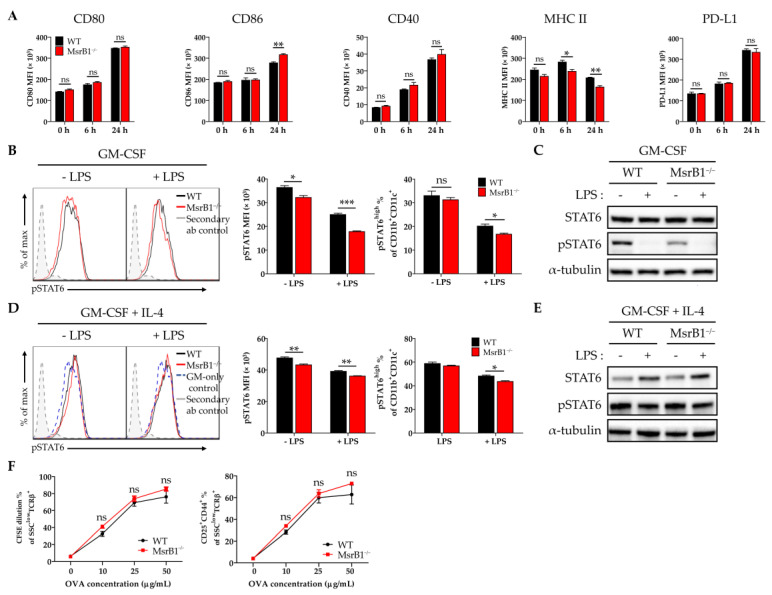
The ability of MsrB1 to control BMDC maturation and T-cell activation associates with MsrB1 regulation of STAT6 activation. (A) WT and MsrB1−/− BMDCs were generated with IL-4 and granulocyte-macrophage colony-stimulating factor (GM-CSF) and treated with LPS for the indicated durations (n = 3 per group). Their expression of CD80, CD86, CD40, MHC II, and PD-L1 was then analyzed by flow cytometry. (B–E) GM-CSF-generated BMDCs (B,C) and IL-4/GM-CSF-generated BMDCs (D,E) were stimulated with LPS for 0 or 30 min (n = 3 per group) and their phosphorylated STAT6 levels were determined by flow cytometry (B,D) and Western blot (C,E). The frequencies of pSTAT-positive activated BMDC populations were determined by gating on the CD11c+CD11b+ cells in the live cells. (F) WT and MsrB1−/− IL-4/GM-CSF-generated BMDCs were loaded with 0, 10, 25, or 50 μg/mL OVA and then cocultured for 3 days with CFSE-stained OT-II cells (n = 3 per group), after which the CFSE dilution and CD25+CD44+ frequencies of the T-cells were measured by flow cytometry by gating on the SSClowTCRβ+ cells in the live cells. Mean ± SEM are shown. * p < 0.05, ** p < 0.01, *** p < 0.001; ns, not significant, as determined by unpaired t-test. The data are representative of two (B,D,F), three (C), or four (A) independent experiments, all of which had similar results.

