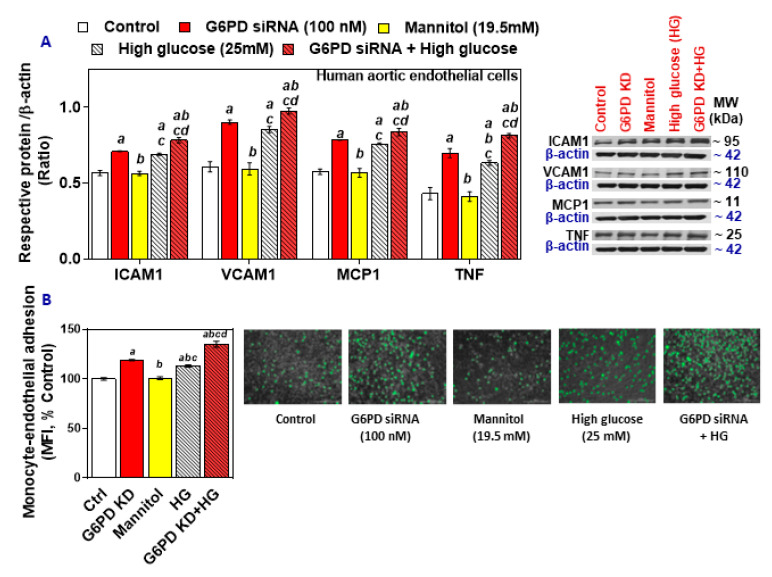
Figure 2.
The effect of treatment with high glucose on cell adhesion molecules (ICAM-1, VCAM-1), MCP-1, and TNF in G6PD-normal and G6PD-deficient HAEC and monocyte-endothelial cell adhesion. (A) Representative Western blot analysis (ICAM-1, VCAM-1, MCP-1, and TNF) performed on total protein. The left panel represents the semi-quantitative analysis of the ratio of protein abundance to β-actin. (B) Phase-contrast images of HAEC and SC monocytic cells (scale bar: 200 μm). Results are mean ± SEM (n = 3–6). Significance at p < 0.05: a, compared with control; b, compared with G6PD siRNA; c, compared with mannitol; d, compared with high glucose.

