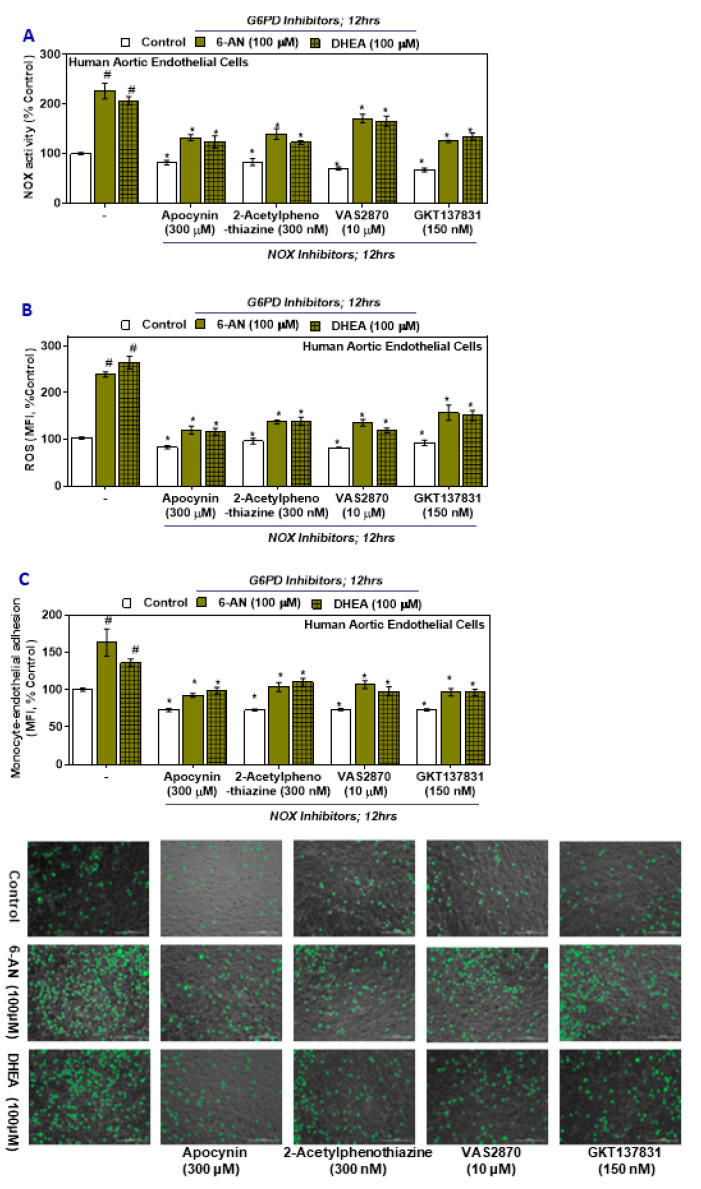
Figure 4.
The effect of G6PD and NOX pharmacological inhibitors on NADPH oxidase activity, ROS in HAEC, and monocyte-endothelial cell adhesion. (A) NADPH oxidase activity. (B) ROS. (C) Phase-contrast images of HAEC and SC monocytic cells (scale bar: 200 μm). Results are mean ± SEM (n = 3–6). Significance at p < 0.05: #, compared with control–G6PD inhibitor groups; *, compared with control–NOX inhibitor groups.

