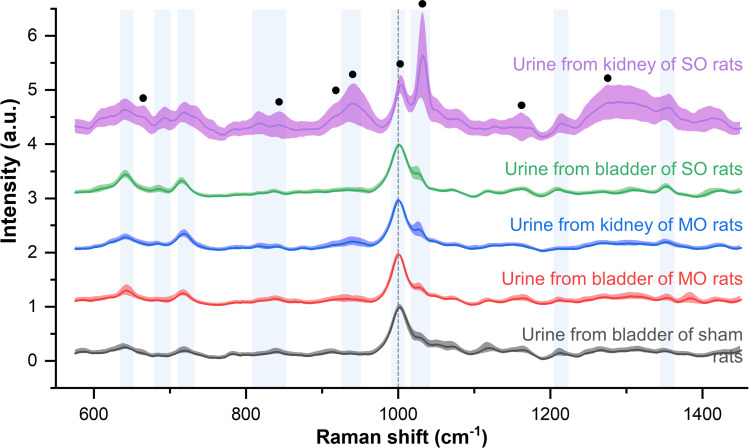
Figure 4.
Averaged Raman spectra from urine samples from the severe obstruction model (purple and green lines), the mild obstruction model (blue and red lines), and the control procedure (red line). The standard deviation is represented by the shaded areas around the solid lines. The black dots indicate the collagen assignment peaks.

