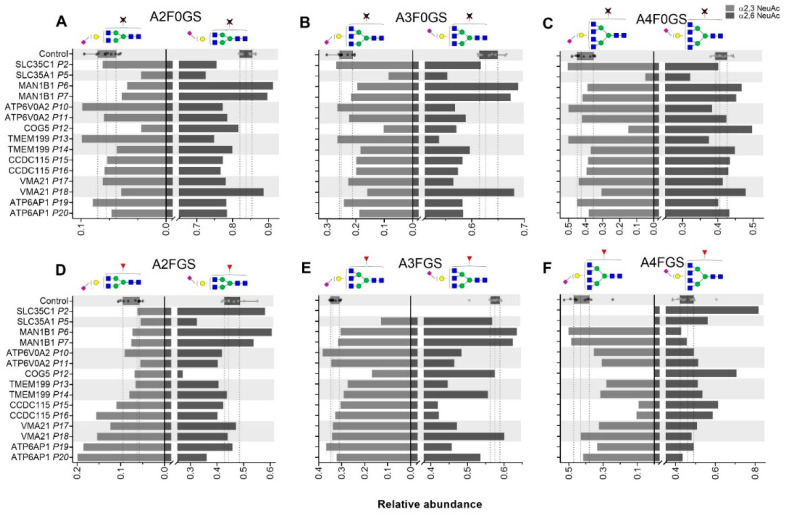
Figure 4.
Total plasma N-glycome (TPNG) structural features determined for CDG patients. Levels of α2,3-sialylation per galactose (left) and α2,6-linked sialylation per galactose (right) are displayed for non-fucosylated (A) diantennary, (B) triantennary and (C) tetraantennary glycans as well as for fucosylated (D) diantennary, (E) triantennary and (F) tetraantennary glycans. The box plot shows the median (dashed line) with the interquartile range (dotted lines) for healthy controls (n = 10) whilst the bars give the individual values determined for the CDG patients.

