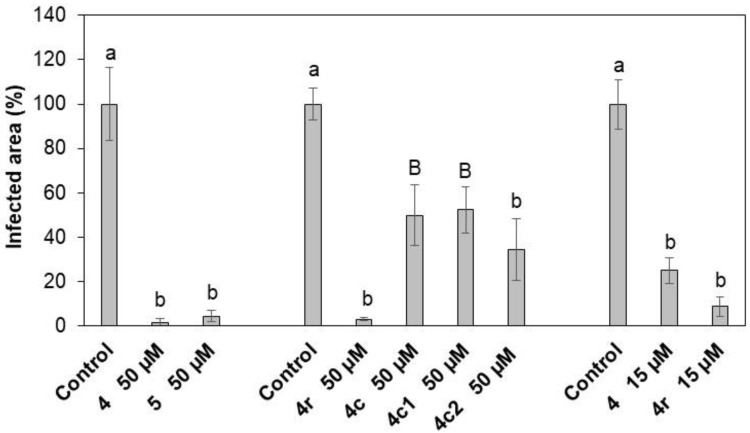
Figure 4.
Symptomatic area of common bean leaves treated with 4, 4r, and 5, and the shorter analogs 4c, 4c1, and 4c2 at 50 or 15 µM and inoculated with B. cinerea conidia. Each treatment was compared to the respective control. The symptomatic leaf area was measured 7 days post-inoculation (dpi) and is expressed as a percentage compared to the control (treated with water). Bars indicate standard error. At least three independent infection sessions were performed. Data were statistically analyzed by one-way Anova Bonferroni–Holm. Different letters indicate significant differences at p < 0.01 (lowercase letters) or p < 0.05 (uppercase letters).

