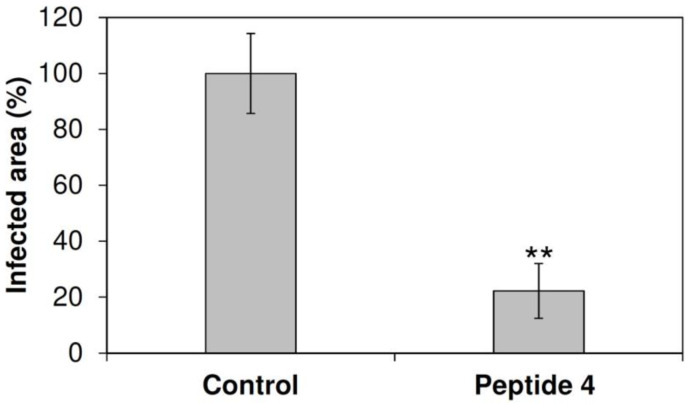
Figure 5.
Symptomatic area of grapevine leaves cv. Glera treated with 4 at 50 µM and inoculated with B. cinerea conidia. The symptomatic leaf area was measured 7 days post-inoculation (dpi) and is expressed as a percentage compared to the control (treated with water). Bars indicate standard error. Three independent infection experiments were performed. Data were statistically analyzed by the Student’s t-test. Each treatment was compared to the respective control. ** indicates significant differences at p < 0.01.

