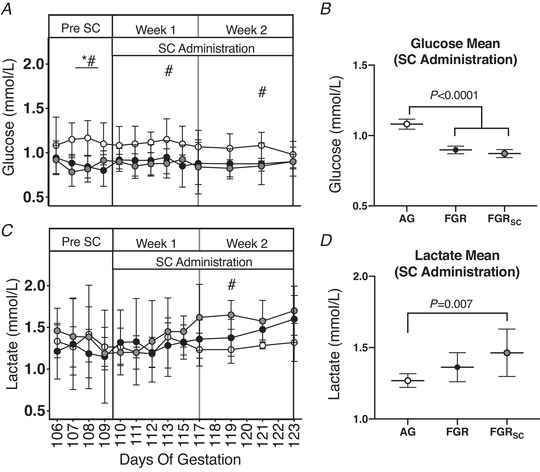
Figure 3. Fetal glucose and lactate in response to growth restriction and sildenafil treatment.

Individual daily mean ± SD glucose (A) and lactate (C). Total mean values for the duration of the treatment period of all parameters are also shown (B and D). Groups are appropriately grown (AG, white, n = 6), saline‐treated fetal growth restricted (FGR, black, n = 7) and sildenafil‐treated fetal growth restricted (FGRSC, grey, n = 7) fetuses. Duration of treatment is indicated by the SC administration bar. *Significant difference between FGR and AG; #significant difference between FGRSC and AG. Daily physiological data collected over the duration of the experiment were analysed using a two‐way repeated measures ANOVA. Weekly mean physiological parameters were analysed using a one‐way ANOVA.
