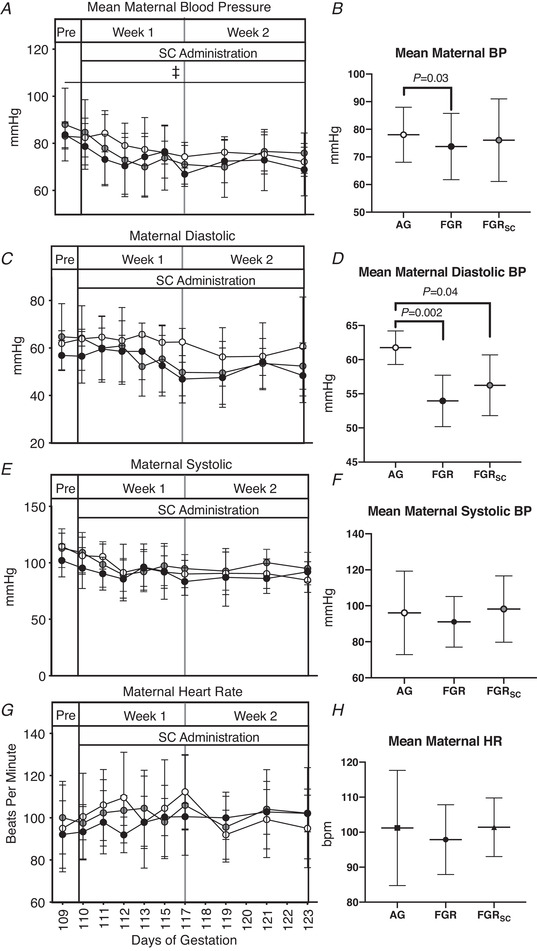
Figure 4. The maternal cardiovascular response to chronic antenatal sc administration.

Individual daily mean ± SD maternal blood pressure (BP, A), diastolic blood pressure (C), systolic blood pressure (E) and heat rate (G). Total mean values for the duration of the treatment period of all parameters are also shown (B, D, F, H). Groups are appropriately grown (AG, white, n = 6), saline‐treated fetal growth restricted (FGR, black, n = 7) and sildenafil‐treated fetal growth restricted (FGRSC, grey, n = 7) fetuses. Duration of treatment is indicated by the SC administration bar. ‡Significant difference over time. Daily physiological data collected over the duration of the experiment were analysed using a two‐way repeated measures ANOVA. Weekly mean physiological parameters were analysed using a one‐way ANOVA.
