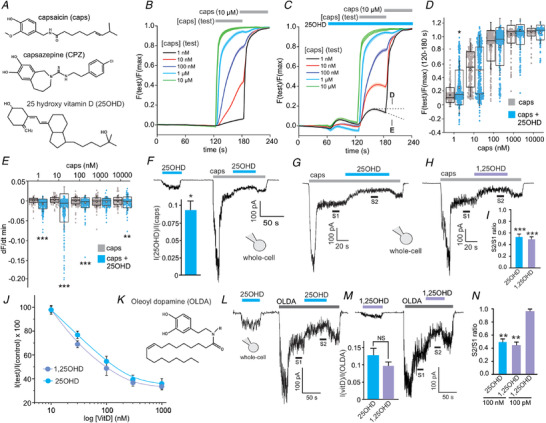
Figure 1. 25OHD is a partial agonist of TRPV1.

A, chemical structures of capsaicin (caps), capsazepine (CPZ) and 25 hydroxyvitamin D (25OHD). B and C, grouped calcium imaging data illustrating the effects of capsaicin alone (1 nM to 1 µm, B) and 25OHD (100 nM) alone or with capsaicin (C) on TRPV1‐mediated calcium influx (Each line represents the average fluorescence signal (F test/F max) from 150–400 cells per condition from 3–4 transfections.) D and E, grouped data analysis of B and C showing the effects of 25OHD (100 nM) on peak TRPV1‐mediated calcium influx (D) and the negative slope of the calcium signal (dF/dT, E). Data presented as quartiles 1–3 boxplots with mean (white square), median (horizonal line) and standard deviation (whiskers). F, representative TRPV1 whole‐cell current recordings of the effects of 25OHD (100 nM) alone or after activation with capsaicin. Bar graph inset shows the ratio of 25OHD‐induced peak current/capsaicin induced peak current (0.1 ± 0.02). G and H, representative TRPV1 whole‐cell current recording illustrating that 25OHD and 1,25OHD (100 nM) inhibit (S2) the capsaicin‐induced TRPV1 current (S1). I, grouped S2/S1 ratio data for G and H. J, concentration–inhibition curves for the effects of 25OHD and 1,25OHD on capsaicin‐induced whole‐cell TRPV1 currents (IC50 = 34.3 ± 0.2 and 11.5 ± 0.9 nM, respectively). K, structure of N‐oleoyldopamine (OLDA). L and M, representative TRPV1 whole‐cell current recording illustrating that 25OHD (L) and 1,25OHD (M) inhibit the TRPV1 current elicited by OLDA (1 µm). M, subpanel: grouped data showing the weak partial agonist effect of 100 nM 25OHD and 1,25OHD when compared to the maximal effect of OLDA (1 µm). N, grouped data for L and M with S2/S1 ratio as 0.49 ± 0.1 and 0.45 ± 0.05 for 25OHD and 1,25OHD, respectively (note that 100 pM 1,25OHD was without effect, representative trace not shown). All experiments were performed in HEK293T cells overexpressing recombinant human TRPV1. Grouped data for the whole‐cell current data are mean ± SD values from n = 3–6 cells per group. Statistical analysis was performed by Student's t test: * P < 0.05, * * P < 0.01, * * * P < 0.005; NS, no significant difference. [Color figure can be viewed at wileyonlinelibrary.com]
