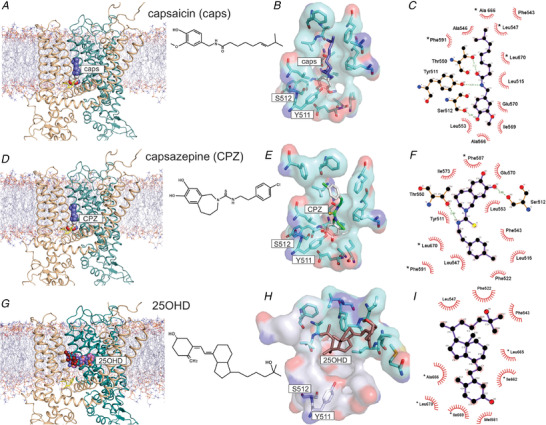
Figure 4. 3D modelling and ligand docking to human TRPV1.

A, D and G, docking results for capsaicin (A), capsazepine (D) and 25OHD (G). A homodimer model (protomer 1, wheat colour; protomer 2, teal colour) embedded in a POPC bilayer is shown. The molecules are shown as spherical form and colour‐coded by elements. B, E and H, the docking of these molecules represented as surface plots. The head and tail groups of capsaicin are shown in white and purple respectively. Capsazepine is shown with hydrophobic groups in white and charged residues coloured. 25OHD is shown in brown with its putative binding pocket coloured cyan versus the capsaicin/capsazepine binding pocket coloured light grey. The oxygen and nitrogen atoms in TRPV1 are shown as red and blue surfaces. TRPV1 interacting residues are labelled and shown in stick format. C, F and I, Ligplot binding pocket analysis for capsaicin (C), capsazepine (F) and 25OHD (I). Green dashed lines indicate hydrogen‐bonding interactions with red line curves indicating hydrophobic interactions pairs of atoms. *Residues belonging to the 2nd protomer. [Color figure can be viewed at wileyonlinelibrary.com]
