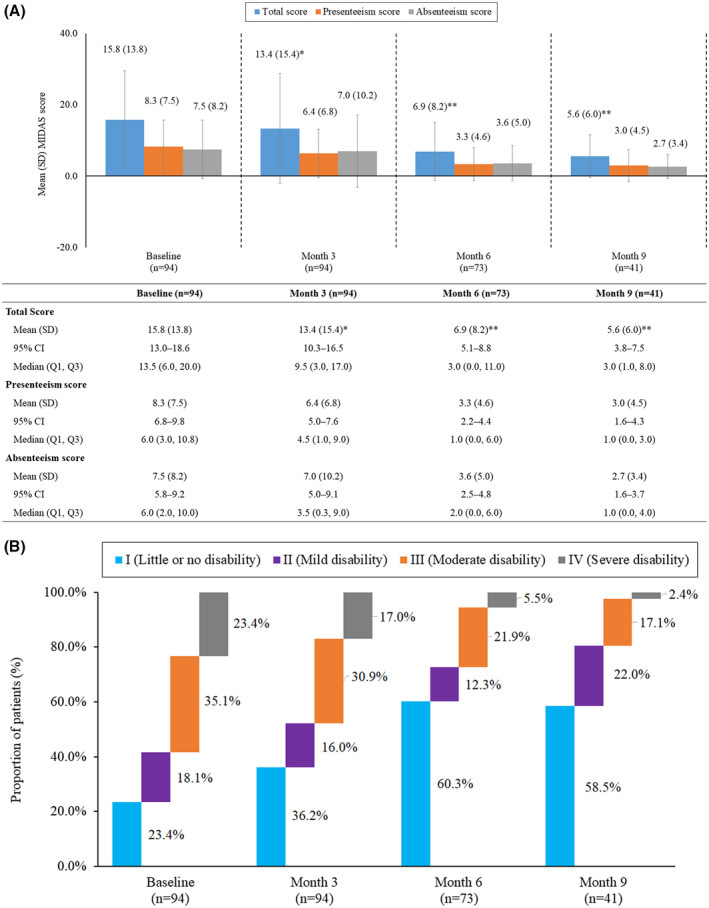
Fig. 3.

Impact of Migraine Care program on (A) Migraine Disability Assessment (MIDAS) scores and (B) MIDAS grades. (A) MIDAS score at baseline through Month 9. *P = .067 vs baseline; **P < .0001 vs baseline. Data presented in the figure are the mean total MIDAS, presenteeism, and absenteeism scores among participants at different time points throughout the Migraine Care program. The error bars represent standard deviations. Values presented in the table are mean (SD, standard deviation), 95% confidence interval (CI), and median (Q1, Q3). Absenteeism score was calculated as the sum of days of work or school, household work, and social activities missed in the last 3 months because of headaches. The presenteeism score was calculated as the sum of days in the last 3 months during which work productivity and household work was reduced by half due to headaches. (B) Change in MIDAS Grades from baseline to Month 9. Grade I (0‐5): Little or no disability. Grade II (6‐10): Mild disability. Grade III (11‐20): Moderate disability. Grade IV (21+): Severe disability.
