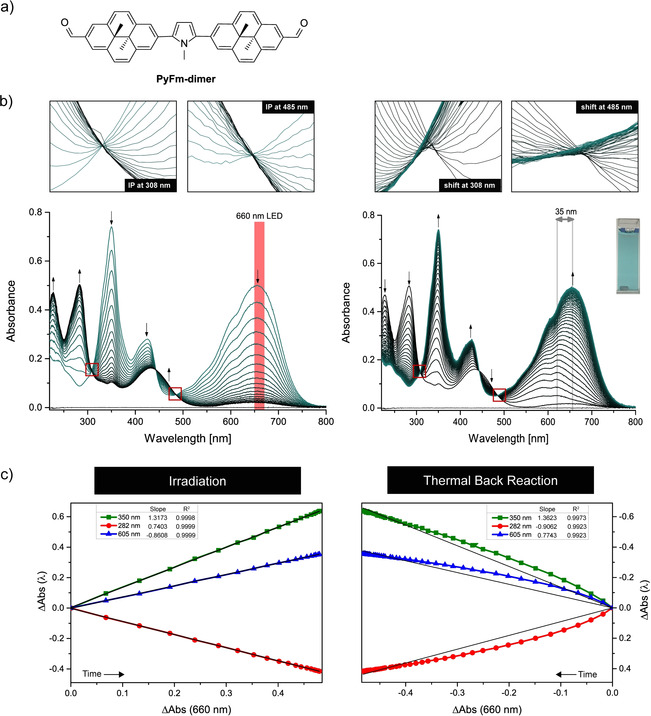
Figure 2.

a) Chemical structure of the investigated PyFm‐dimer. b) UV/vis spectral changes upon irradiation with a 660 nm LED (left, 1 min between consecutive spectra) and during thermal back reaction (right, 2 min between consecutive spectra) of PyFm‐dimer at 0 °C in THF (7.5×10⁻⁶ M). Insets above show the presence or absence of isosbestic points (IP) in enlarged spectral regions. c) Respective absorbance difference diagrams.
