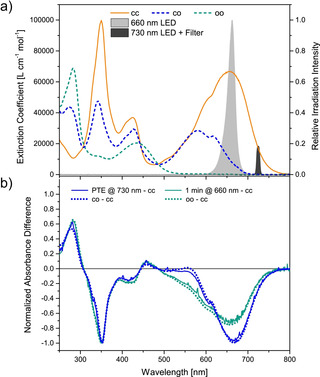
Figure 4.

a) Absorption spectra of all three isomers of the PyFm‐dimer. While the spectrum of the closed‐closed isomer has been measured, the ones for the closed‐open and open‐open isomers have been derived from the calculated concentrations (see Figure S31). b) Differential spectra obtained during irradiation experiments using either 660 nm (270 mW, for 1 min) or 730 nm (50 mW, until reaching the photothermal equilibrium (PTE)) excitation (solid lines), showing the presence of the open‐open and closed‐open isomer, respectively, by matching the calculated spectra (dotted lines). The spectral profile and relative intensity of the utilized light sources are shown in a).
