
Figure 5.
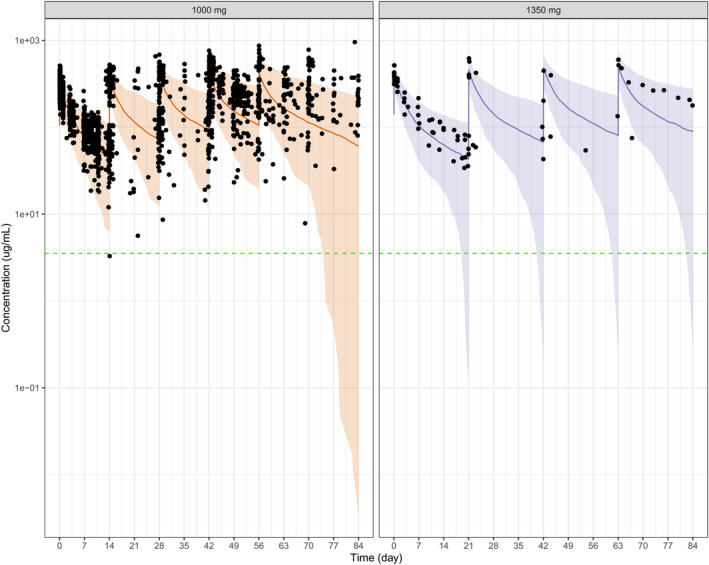
Observed and model predicted concentrations of emactuzumab following repeated i.v. administration of (a) 1,000 mg q2w and (b) 1,350 mg q3w. Green lines indicate median. Grey shaded regions indicate 95% prediction intervals. [Colour figure can be viewed at wileyonlinelibrary.com]