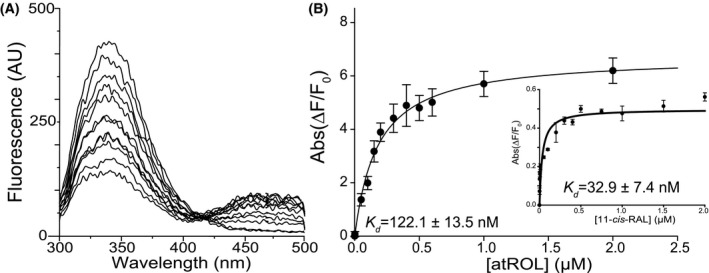
Figure 1.

Biochemical characterization of purified IRBP. A, Fluorescence spectra of apo‐IRBP upon titration with at‐ROL. B, Changes in the emission maxima at 480 nm and 350 nm (inset) plotted vs. the concentration of at‐ROL and 11c‐RAL (inset) were fit to a one‐site saturation ligand‐binding model (R sqr = .983 for the fluorescence signal at 480 nm and R sqr = .980 for the fluorescence signal at 350 nm) and used to calculate K D values. The experiments were repeated three separate times, each time in triplicate. Data are presented as mean values ± SD
