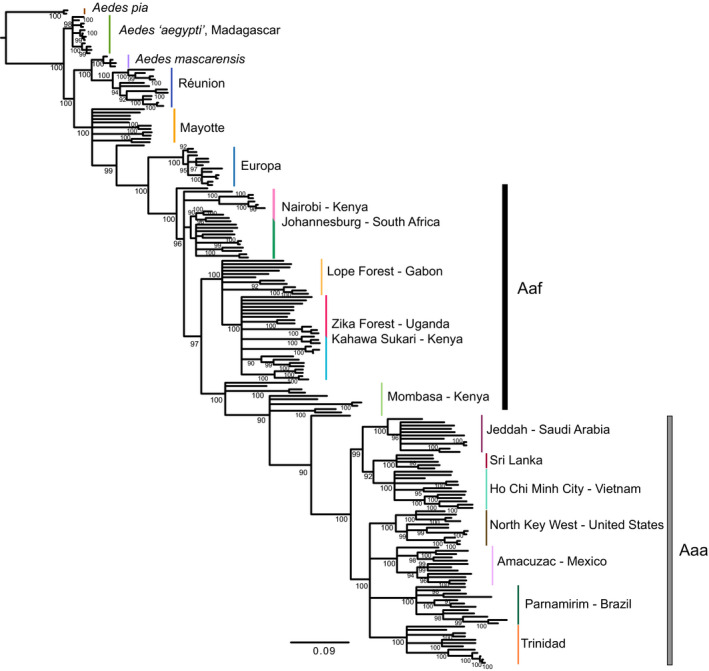
FIGURE 4.

The maximum‐likelihood phylogeny estimated from Aegypti Group SNP data demonstrates the deep divergence of Aedes aegypti from Madagascar from populations of Aedes aegypti s.s. Narrow coloured vertical bars reflect species or population of origin. Black and grey bars reflect populations of Aedes aegypti s.s. assigned to one of the two subspecies Aedes aegypti formosus (Aaf) or Aedes aegypti aegypti (Aaa). The phylogeny was estimated in IQ‐Tree and was rooted on the branch leading to Aedes pia. Support values are ultrafast bootstraps estimated in IQ‐Tree, and branches with support values below 90 have been collapsed. Scale is in substitutions per site
