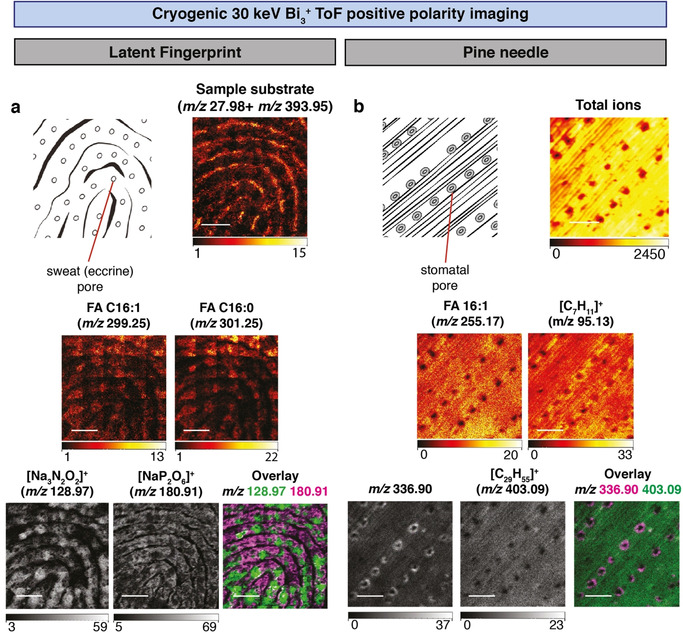
Figure 2.

Localization of semi‐volatile molecules in pine needles and latent fingerprints using Cryo‐OrbiSIMS. a) Positive polarity imaging of a latent fingerprint (diagram indicates eccrine pores) using a 30 keV Bi3 + LMIG with an approximate spot size of 0.5 μm and ToF analyzer of a 2.5×2.5 mm field of view with 5120×5120 pixel resolution, binned to 1280×1280 pixels. Sample substrate refers to the sum of m/z 27.98 (Si+) and m/z 393.95 (Au2 +), components of the gold‐coated silicon wafer. Other mass images show four compounds detected at cryogenic but not at ambient temperatures. Fingerprint putative annotations: m/z 299.1956 (detected in Orbitrap and ToF spectra), [C16H29O2Na2]+ (Orbitrap mass deviation δ−0.5 ppm), hexadecenoic acid (FA 16:1) adduct [M+2 Na−H]+. m/z 301.2113 (detected in Orbitrap and ToF spectra), [C16H31O2Na2]+ (Orbitrap mass deviation δ−0.4 ppm), palmitic acid (FA 16:0) adduct [M+2 Na−H]+. m/z 128.97 (detected only in ToF spectra), [Na3N2O2]+ (ToF mass deviation δ 30.6 ppm) localizes close to sweat pores. m/z 180.91 (detected only in ToF spectra), [NaP2O6]+ (ToF mass deviation δ 31.2 ppm) localizes in a pattern excluding sweat pores. Scale bars represent 0.625 mm. b) Positive polarity imaging of a pine needle (Pinus nigra, diagram indicates stomatal pores) using a 30 keV Bi3 + LMIG with an approximate spot size of 0.5 μm and ToF analyzer of a 500×500 μm field of view with 1024×1024 pixel resolution, binned to 256×256 pixels. Total ion count image shows position of stomatal pores and m/z 366.90 provides a diagnostic ion for the guard cells surrounding the pores and is detected at cryogenic but not ambient temperature. Pine needle putative annotations: m/z 255.17, [C18H35O2]+, linoleic acid (FA 18:2) adduct [M+H]+ is detected at both cryogenic and ambient temperatures and with the Orbitrap analyzer (m/z 255.2317 and mass deviation δ−0.7 ppm). m/z 95.12, [C7H11]+, likely represents a volatile hydrocarbon fragment and is also detected by EI‐GC‐MS/MS and OrbiSIMS MS/MS analysis of hydrocarbon standards (Supplementary Figure 4). m/z 403.09, [C29H55]+, is a C29:0 hydrocarbon adduct [M−5 H]+ also detected with the Orbitrap analyzer (m/z 403.4295 and mass deviation δ−0.7 ppm) and in the [M]+. form via GC‐MS alongside a commercial standard (Supplementary Table 1). The [M−5 H]+ ion is not the most abundant hydrocarbon adduct but is shown due to clear separation from surrounding peaks. Scale bars represent 125 μm. In both panels, the intensity ranges (in counts) are represented beneath each mass image.
