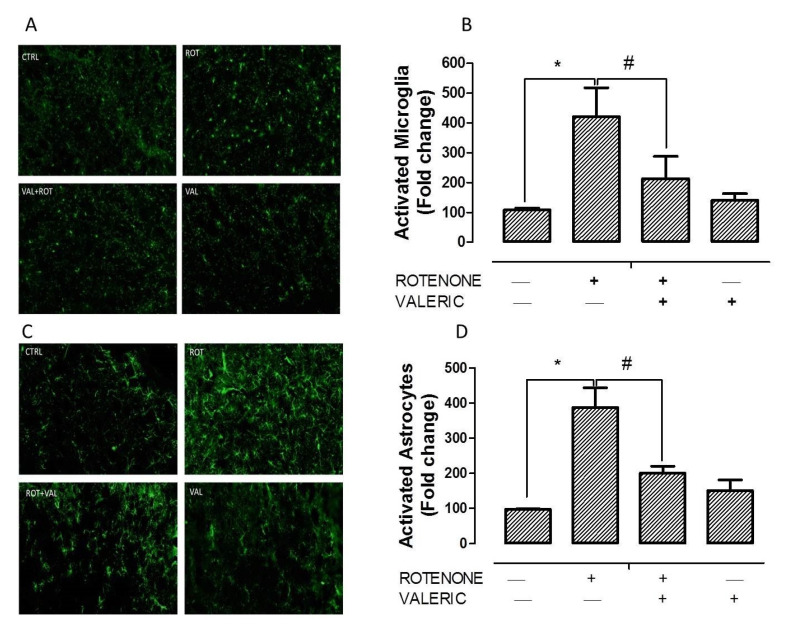
Figure 3.
Valeric acid attenuated microglia and astrocyte activation induced by rotenone. Immunofluorescent staining with Iba-1 (A) and GFAP (C) of experimental animals. Picture shows 20 µm thick sections of striatum between different groups. Densitometric assessment of fluorescent intensity to quantify microglia (B) and astrocyte (D) activation. Rotenone administration caused profound increase in Iba-1 positive microglia and GFAP positive astrocyte. Alternatively, Val treatment decreased the activation of microglia and astrocyte as evinced by decrease in Iba-1 and GFAP positive cells. Values are expressed as mean ± SEM. * p < 0.05 compared to control, # p < 0.05 compared to rotenone treated group.

