Figure 5.
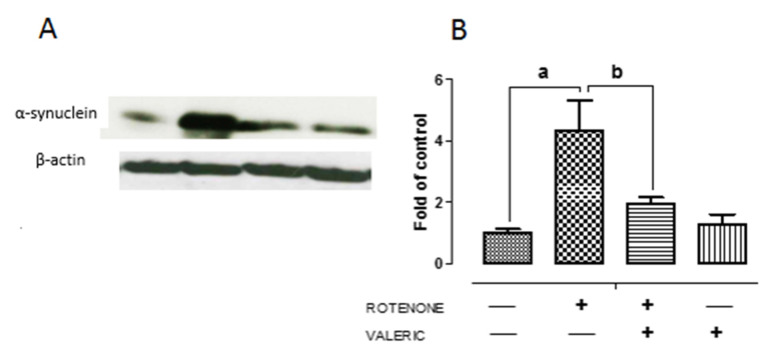
Valeric acid treatment regulates the expression of α-synuclein in experimental animals. Representative immunoblots of alpha-synuclein expression in experimental animals (A). Band intensity was quantified using Image J and depicted as bar diagram (B). Data are expressed as mean ± SEM. a p < 0.05 compared to control, b p < 0.05 compared to rotenone treated group.

