
Figure 6.
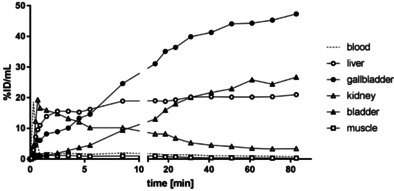
In vivo biodistribution of radioactivity in an adult C57BL/6 mouse after intravenous injection of [18F]‐2. Time–activity concentration curves illustrate tracer dynamics in selected regions of interest (ROI). Activity is displayed as percentage of injected dose per volume during the whole observation period of 90 min.