
Table 1.
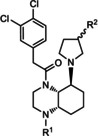
Affinities of hydroxylated and fluorinated perhydroquinoxalines and reference compounds towards KOR and related receptors.
|
| |||||||
|---|---|---|---|---|---|---|---|
|
Compd. |
R1 |
R2 |
Ki±SEM [nM]/% inhibition at 1 μM[a,b] |
||||
|
KOR |
MOR |
DOR |
σ1 |
σ2 |
|||
|
[3H]U‐69,593 |
[3H]DAMGO |
[3H]DPDPE |
(+)‐[3H]pentazocine |
[3H]DTG |
|||
|
1a13 |
CO2C(CH3)3 |
H |
3.8±1.2 |
260 |
438 |
12 % |
16 % |
|
1b13 |
H |
H |
0.54±0.15 |
28 % |
205 |
0 % |
5 % |
|
1c13 |
CO2CH3 |
H |
1.3±0.4 |
0 % |
250 |
0 % |
8 % |
|
12 a |
CO2C(CH3)3 |
(S)−OH |
16±2 |
9 % |
5 % |
0 % |
0 % |
|
12 b |
H |
(S)−OH |
2.0±0.5 |
29 % |
246 |
2 % |
0 % |
|
12 c |
CO2CH3 |
(S)−OH |
9.2±6.0 |
5 % |
693 |
0 % |
5 % |
|
14 b |
H |
(R)−F |
1.5±0.4 |
2 % |
251 |
0 % |
0 % |
|
14 c |
CO2CH3 |
(R)−F |
0.82±0.69 |
0 % |
12 % |
8 % |
962 |
|
U‐50,488 |
|
|
0.34±0.07 |
– |
– |
– |
– |
|
Naloxone |
|
|
7.3±0.40 |
2.3±1.1 |
103 |
– |
– |
|
Morphine |
|
|
– |
5.2±1.6 |
– |
– |
– |
|
SNC80 |
|
|
– |
– |
1.2±0.5 |
– |
– |
|
(+)‐pentazocine |
|
|
– |
– |
– |
5.4±0.5 |
– |
|
Haloperidol |
|
|
– |
– |
– |
6.6±0.9 |
78±2.3 |
[a] A value in % reflects the inhibition of the radioligand binding at a test compound concentration of 1 μM. K i values without SEM values represent the mean of two experiments (n=2) and K i values with SEM values represent the mean of three experiments (n=3). [b] Guinea pig brain membrane preparations were used in the KOR, MOR and σ1 assay. In the DOR assay rat brain and in the σ 2 assay rat liver membrane preparations were used.