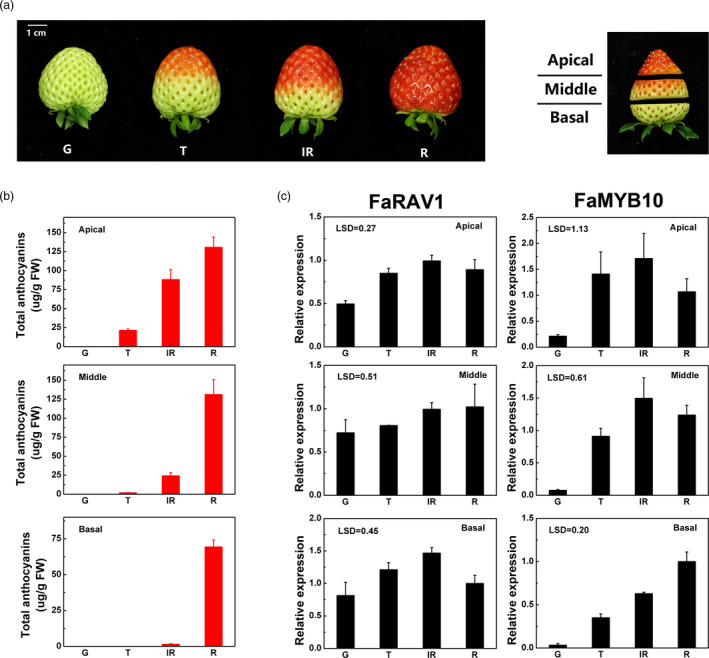
Figure 3.

Relative expression of FaRAV1, FaMYB10 and total anthocyanins during strawberry (cv. Yuexin) fruit development and ripening. a, Fruits were collected at four stages: G, green; T, turning; IR, intermediate red; and R, full red. Three sections were sampled: apical; middle; and basal. b, Changes in the contents of total anthocyanins in each of the three sections at four developmental stages. FW, fresh weight. C, Relative expression levels of FaRAV1 and FaMYB10. The expression levels were calculated relative to corresponding values in the basal section at the R stage. Error bars represent SE based on three biological replicates. LSD values represent LSD at P = 0.05.
