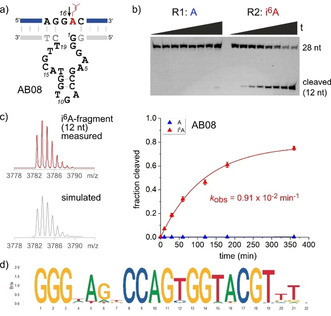
Figure 3.

a) Secondary structure prediction of AB08 and indicated cleavage site of i6A RNA. b) Gel image and kinetic graph demonstrating selectivity for i6A‐modified RNA. Time points are: 0 and 10 min; 0.5, 1, 2, 3, 6, and 22 h. c) HR‐ESI‐MS confirming the cleavage site of R2. Top: measured spectrum of 12‐nt i6A‐modified fragment (i6ACUUCCGUAACU). Bottom: simulated spectrum for C117H149N40O83P11 with an exact mass of 3782.58 amu. d) Sequence logo for alignment of 54 sequences (within a Levenshtein distance of 4 from AB08), represented in the active fraction of the enriched DNA library.
