
Figure 5.
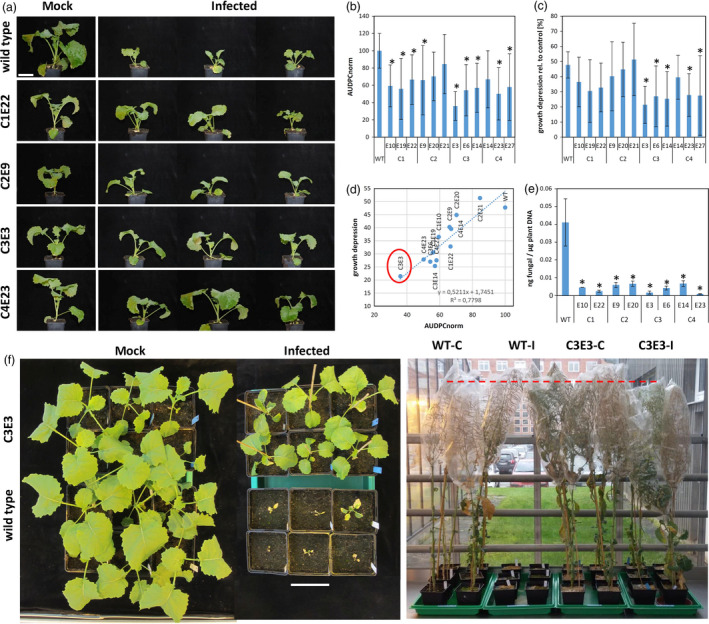
CRT1a CRISPR mutants display reduced susceptibility. (a) T2 progenies of four independent events were photographed at 28 dpi with Verticillium longisporum (after infection with 1 × 10⁶ spores/mL). Some CRT1a mutants display better growth under infected conditions when compared to the wild type shown on top. The scale bar equals 9 cm. (b) Disease rating according to Eynck et al. (2007). The area under the disease progress curve (AUDPC) was determined starting at 7 dpi weekly until 28 dpi, and growth depression (c) was determined at 28 dpi and calculated from 10 individual plants. (d) Correlation analysis between (a) and (b) shows the best value for C3E3. (e) Fungal DNA was quantified via qPCR using the petioles of the first two true leaves harvested at 28 dpi. Statistical analysis was done by Dunnett's t‐test, and significant changes are marked by asterisk (*P ≤ 0.05). (f) The mutant C3E3 was infected a second time, now with 1 × 10⁷ spores/mL and photographed at 28 dpi (left) and after 21 weeks (right). The scale bar equals 13 cm.