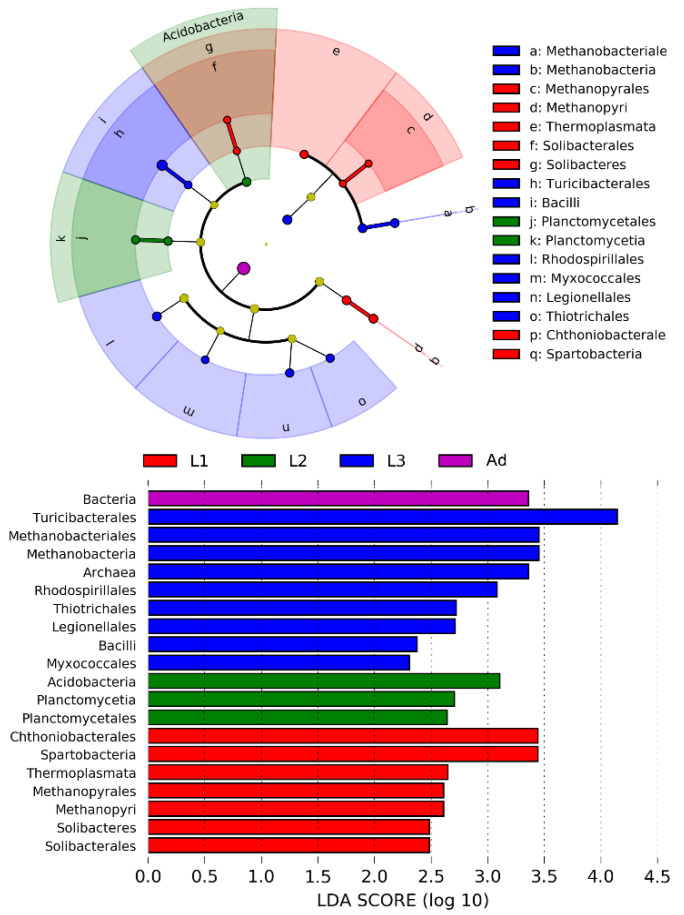
Figure 3.
LEfSe analysis of intestinal bacterial biomarkers associated with host types. Identified phylotype biomarkers ranked by effect size, and the alpha value was < 0.05. Cladogram representing the taxonomic hierarchical structure of the phylotype biomarkers identified among four host types, red, phylotypes overrepresented in gut of L1; green, phylotypes statistically overrepresented in gut of L2; blue, phylotypes statistically overrepresented in gut of L3; purple, phylotypes statistically overrepresented in gut of Ad. L1, 1st instar; L2, 2nd instar; L3, 3rd instar; Ad, Adults.

