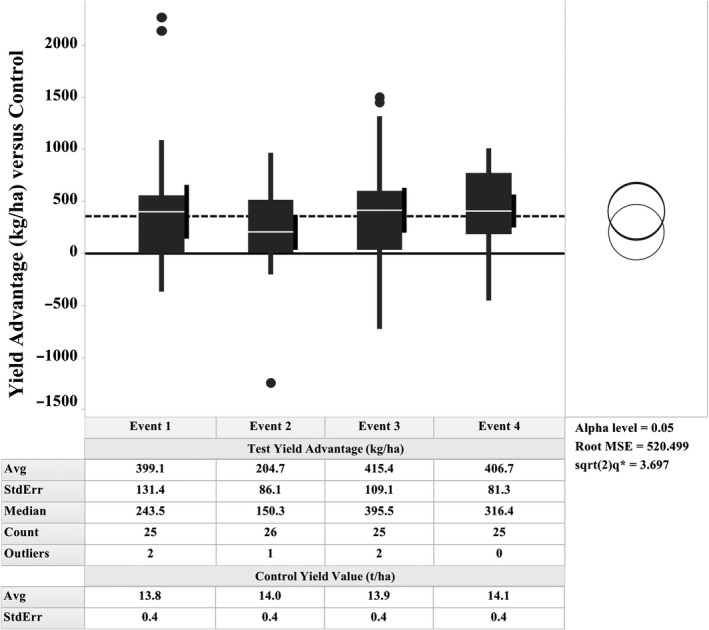
Figure 2.

Yield Advantages of ZM‐BG1H1 OE Event versus Control. Box plot of hybrid maize yield difference (kg/ha) relative to non‐transgenic hybrid controls for each of the 4 transgenic events across two years of testing. Non‐transgenic hybrid control average yield value set to 0 on Y‐axis. The average yield advantage across all four alleles central dashed line across figure at 355 kg/ha or 5.65 bu/ac. Per each event the average (white line inside each box), 95% confidence interval (black vertical segment adhering right side each box) and outlier values above or below (dots). Significance null hypothesis test (i.e. no difference among the 4 events) not rejected at alpha level 0.05, represented by overlapping rings graph at right (Tukey–Kramer significance test). The control hybrid yields averages, and standard error values for each event in the lower table inset.
