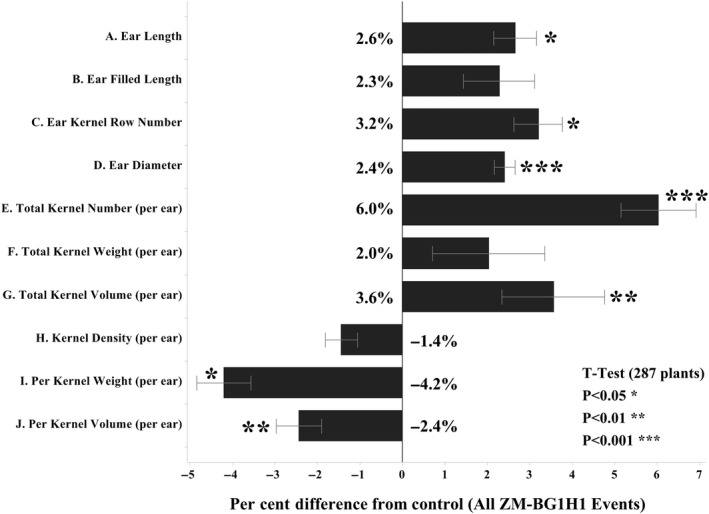
Figure 5.

Ear and Kernel Metrics. Ear and kernel traits for ZM‐BG1H1 OE relative to control. All traits are normalized for comparison to the average per cent differences from control average for all the plants across all four events. The standard error bars are derived from the respective individual plant percentage differences from the control average. The t‐test significance was done by comparing the set of percentage differences from the control average for the all individual plants across all 4 events, to the set of per cent differences among the individual control plants to the control average value. Source data analysis provided in Table S4.
