
Figure 6.
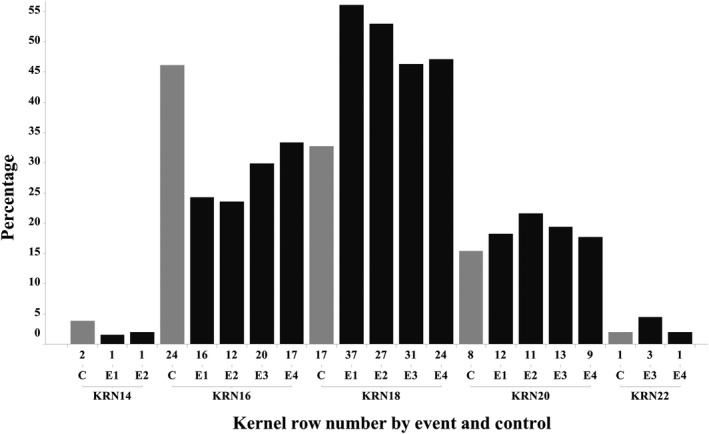
ZM‐BG1H1 OE Increases Kernel Row Number. Histogram percentage distribution of KRN among the four events (E) and Control (C) in the Yr3‐OBS plot. Note the relative shift of KRN from KRN16 to KRN18 for all four ZM‐BG1H1 OE events but a decline for the control. KRN is kernel row number followed by the specific number of rows; for example, KRN20 has 20 kernel rows. The number of plants (=ears) for each category immediately below the bars.