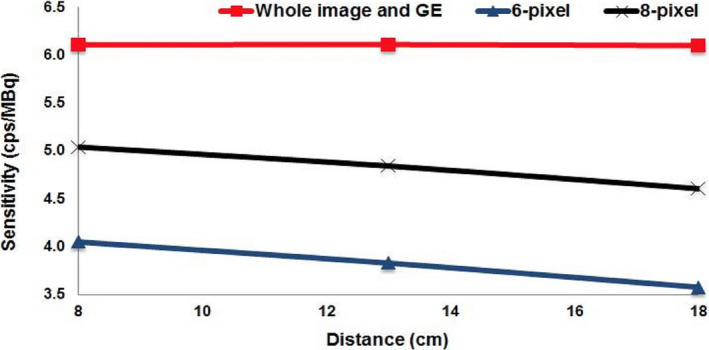
Fig. 2.

Planar sensitivity variation with source to collimator distance for GE‐Discovery NM/computed tomography 670. Red line was generated using the whole image. Blue and black lines were generated using two circular ROIs different in diameter. [Color figure can be viewed at wileyonlinelibrary.com]
