Figure 1.

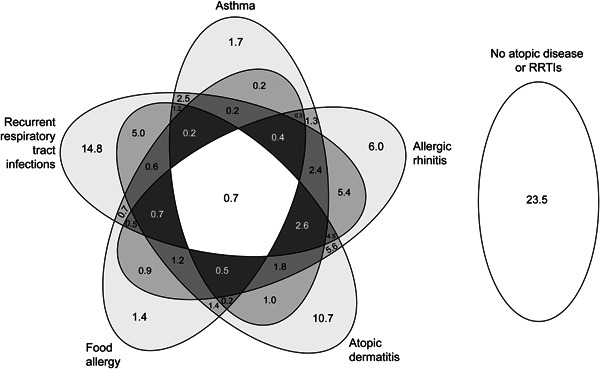
Venn diagram displaying the proportion of atopic diseases and respiratory tract infections in all included children. The numbers are percentages

Venn diagram displaying the proportion of atopic diseases and respiratory tract infections in all included children. The numbers are percentages