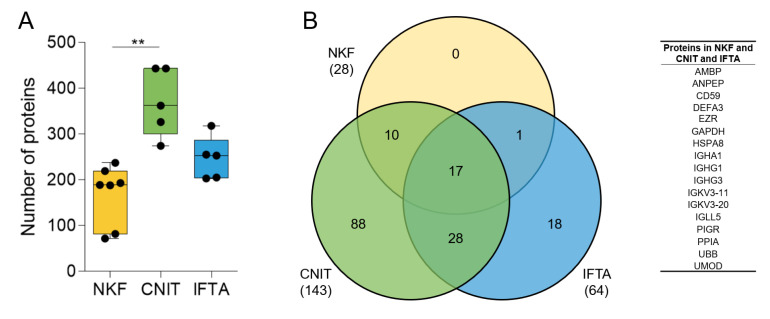
Figure 1.
(A) Number of proteins found by mass-spectrometry in uEV samples in each group. Whiskers represent minimum to maximum; horizontal line represents the mean (** p < 0.01). (B) Venn diagram showing the number of coinciding proteins between the samples of each group (in brackets) and between the all the samples in the study (number in the corresponding circles). On the right, list of the 17 proteins found in all samples.

