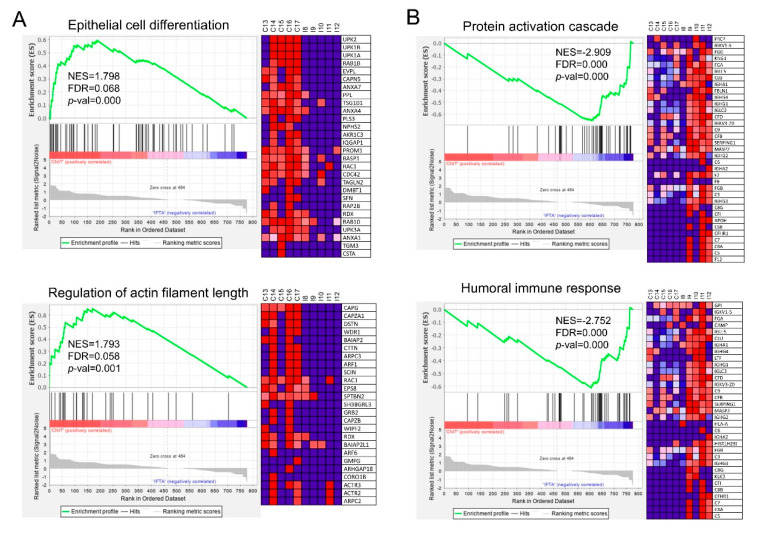
Figure 4.
Enrichment plots from GSEA conducted with GO-BP gene sets, each gene accounting for one protein. Statistically significant up-regulation of (A) “epithelial cell differentiation” and “regulation of actin filament length” was found in CNIT when compared with IFTA (to the left of the x-axis, positive running enrichment score (ES)). (B) “Protein activation cascade” and “humoral immune response” were found up-regulated in IFTA compared to CNIT (to the right of the x-axis, negative ES). Vertical black lines indicate the position of individual genes of the gene set in the ranked list. Heatmap on the right of each plot show the relative expression level of the most up-regulated genes of the gene set (red = high, blue = low). NES, normalized enrichment score; FDR, false discovery rate; p-val, p-value.

