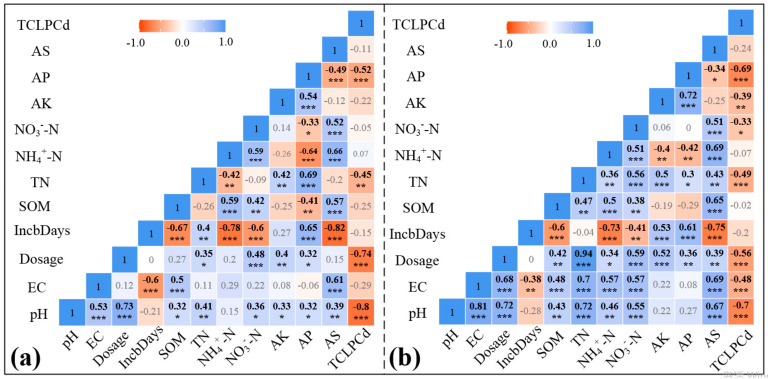
Figure 4.
Pearson correlation matrixes for the relationships between physical and chemical properties of the soils, incubation days, biochar dosages, and availability of Cd in the soils. (a) PBC600; (b) TPBC600. * indicates that p < 0.05 (significant); ** indicates that p < 0.01 (very significant); *** indicates that p < 0.001 (extremely significant).

