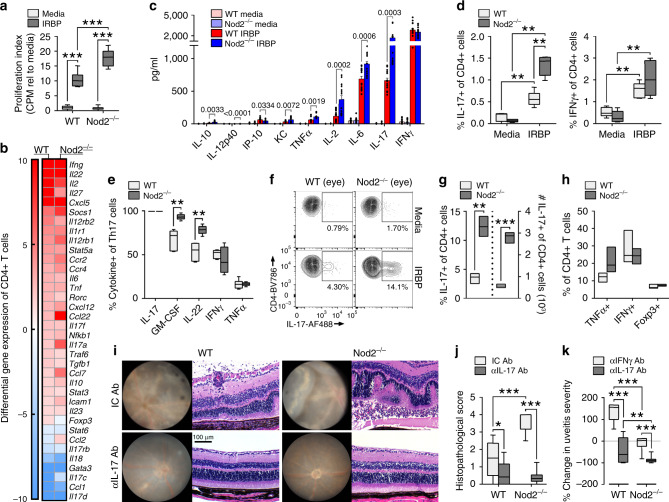
Fig. 3. Nod2 negatively regulates hyper-pathogenic Th17 cells.
Splenocytes from immunized WT and Nod2−/− mice were stimulated in vitro with IRBP1–20 (a–e). a [3H] thymidine incorporation after 72 h. Data are combined from 3 independent experiments, n = 12 mice/group; ***p < 0.0001. b Gene expression of CD4+ T cells 18 h was assessed by qPCR. Heatmap indicates expression relative to IRBP1–20-stimulated CD4+ T cells from adjuvant-control mice. c Cytokine production after 48 h was assessed by ELISA. Data are combined from 4 independent experiments, n = 16 mice/group. d Frequencies of IL-17+ or IFNγ+ of CD4+Thy1.2+ T cells was determined by flow cytometry. Data are combined from 2 independent experiments, n = 5 (unstimulated) or 6 (IRPB-stimulated) mice/group. IL-17: **p = 0.0043 (WT unstimulated vs. WT peptide, Nod2−/− unstimulated vs. Nod2−/− peptide), **p = 0.0022 (WT peptide vs. Nod2−/− peptide). IFNγ: **p = 0.0043 (WT unstimulated vs. WT peptide), **p = 0.0025 (Nod2−/− unstimulated vs. Nod2−/− peptide). e Proportion of Th17 cells (IL-17+CD4+Thy1.2+) co-producing cytokines. Data are combined from 2 independent experiments, n = 6 mice/group; **p = 0.0022. f–h Ocular cells from immunized mice were stimulated in vitro with IRBP1–20 for 18 h. Data are combined from 3 independent experiments, n = 6 mice pooled/genotype. f Representative contour plot showing IL-17+CD4+ T cells. g IL-17+ cells from gated live CD4+Thy1.2+ T cells. **p = 0.0013 (%), ***p = 0.0001 (#). h CD4+Thy1.2+ T cells co-expressing TNFα, IFNγ, or Foxp3. i–k The effect of cytokine neutralization on uveitis was evaluated clinically and histopathologically 21 days post-immunization. Data are combined from 3 independent experiments, n = 18 (WT IC, WT αIL-17), 19 (WT αIFNγ, Nod2−/− IC), 17 (Nod2−/− αIL-17, or 23 (Nod2−/− αIFNγ) mice. i Representative images of fundi and H&E-stained retinal sections 21 days post-immunization. j Uveitis scores from histopathology. *p = 0.0095 (WT IC vs. WT IL-17 Ab), ***p < 0.0001 (Nod2−/− IC vs. Nod2−/− IL-17 Ab, WT IC vs. Nod2−/− IC). k Uveitis scores (from j) were normalized to the IC Ab group within each genotype (baseline = 0); **p = 0.0035, ***p < 0.0001. Data are box-whisker plots showing median with 25th–75th percentile and min–max range (a, d–e, j, k), floating bars showing median with min–max range (g, h), or mean ± SEM (dots represent individual values) (c). Data were analyzed by two-tailed Mann–Whitney U test (a, d–e, h, j) or unpaired, two-tailed Student’s t-test (c, g, k). Source data are provided as a Source Data file.

