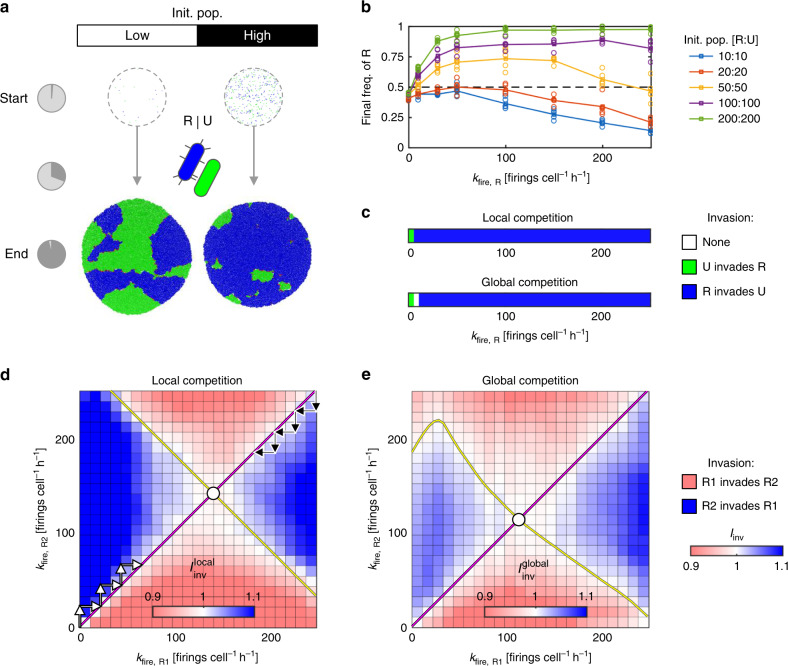
Fig. 1. The evolution of random T6SS firing.
a Simulation snapshots showing initial and final cell configurations for surficial competition between T6SS− Unarmed strain (U, green) and a Random-firing T6SS+ strain (R, blue). Simulations are carried out for both low and high initial cell densities (left and right columns; initial cell populations 10 vs. 10 and 200 vs. 200 cells, respectively); pie charts (left) indicate the consumption of patch resources. Firing rate kfire,R = 50 firings cell−1 h−1. b Competition outcomes, measured by final R cell proportion, as a function of firing rate kfire,R for increasing initial cell densities (see legend, right). Circles and lines correspond to data points and their means, respectively. c Invasion plots showing outcomes of local and global invasion analyses for R vs. U competition (see “Methods”), as a function of firing rate kfire,R, for high initial cell density (200 vs. 200 cells); additional cases are shown in Supplementary Fig. 3. d, e Pairwise invasion plots for competing R-type strategists (R1, R2), showing invasion outcomes for local (d) and global (e) competition scales for intermediate cell density (50 vs. 50 cells). Arrows illustrate progression of evolving firing rates kfire,R, converging on evolutionary stable strategy firing rates (ESS, white circles). Simulation parameters used throughout: Nhits = 2, c = 0.001; n = 5 simulation replicates per case in b, c and n = 10 per case in d, e. Source data are provided as a Source Data file.

