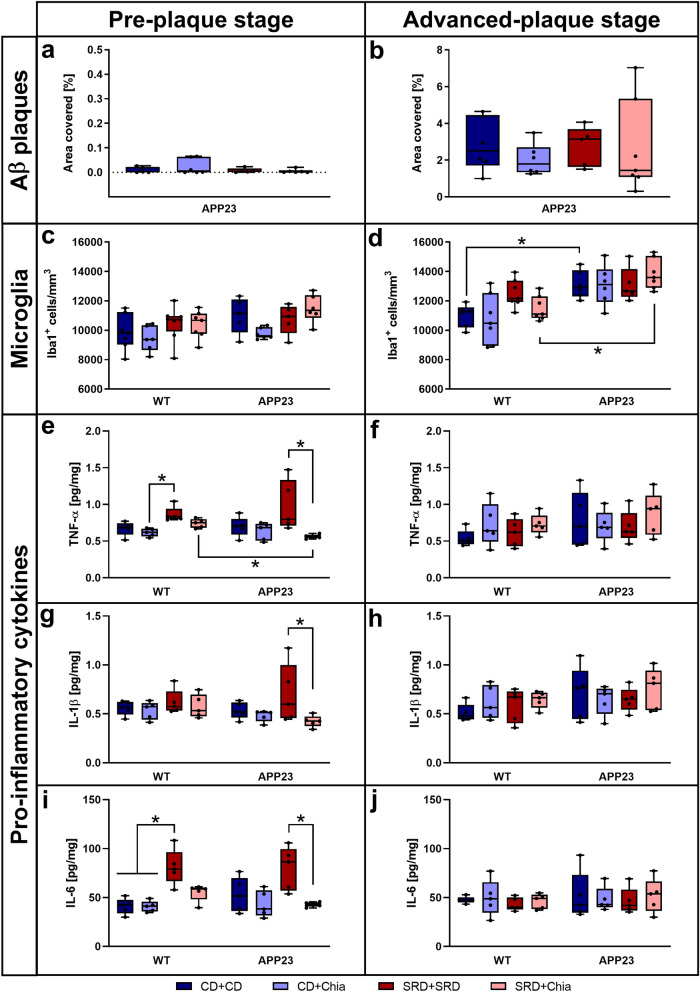
Figure 6.
ADV APP23 mice show increased Aβ plaque load and elevated numbers of microglia in the hippocampus. Pro-inflammatory cytokine levels are increased by SRD but only in the PRE group. (a,b) Aβ plaque load represented by the percentage of area covered with pFTAA-positive plaques in the hippocampus and cortex of PRE (a) and ADV mice (b). (c,d) Number of microglia/macrophages expressing Iba1+ per mm3 in the hippocampus of PRE (c) and ADV mice (d). (e,f) TNF-α levels [pg/mg] in the hippocampus of PRE (e) and ADV (f) mice. (g,h) IL-1β levels [pg/mg] in the hippocampus of PRE (g) and ADV (h) mice. (i,j) IL-6 levels [pg/mg] in the hippocampus of PRE (i) and ADV (j) mice. Each box represents the 25th to 75th percentile, the line represents the median, whiskers reach from minimum to maximum. An asterisk indicates significant differences between groups regardless of significance level (p < 0.05), according to nonparametric multiple contrast Tukey-type test. WT wild type control, APP23 transgenic mouse model, PRE pre-plaque stage, ADV advanced-plaque stage, CD control, SRD sucrose-rich, Chia chia seed supplementation, Iba1 allograft inflammatory factor 1, TNF-α tumor necrosis factor-α, IL interleukin.

