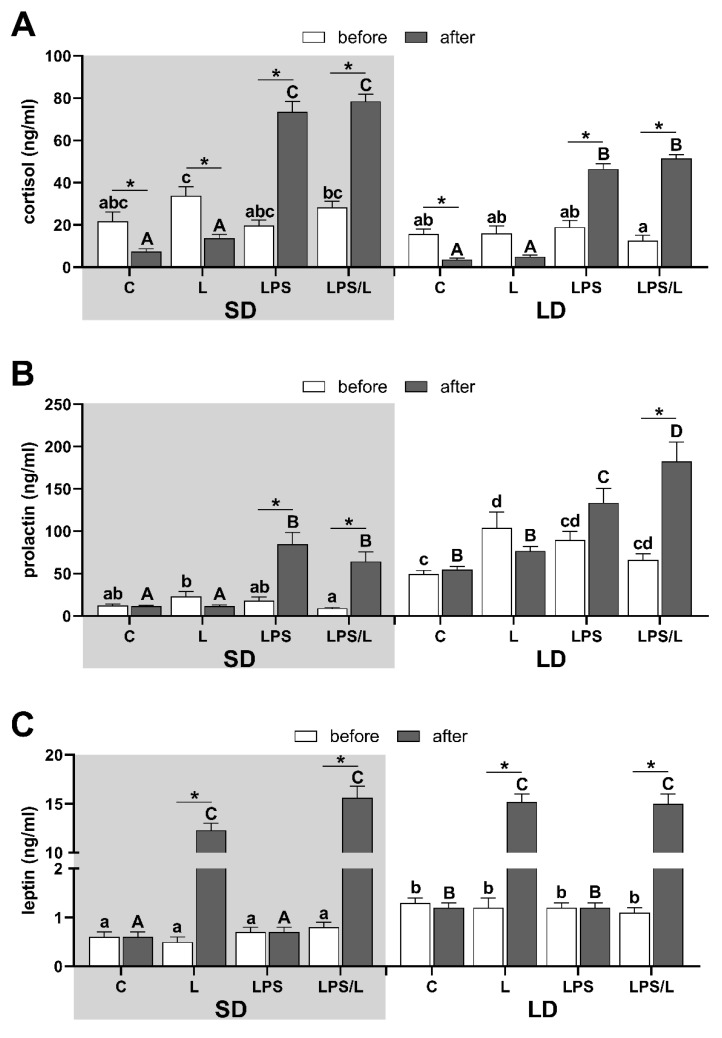
Figure 1.
The overall mean (±SEM) concentration of cortisol (A), prolactin (B) and leptin (C) in blood plasma during the short days (SD, grey background) and the long days (LD, white background) in control (C), leptin-injected (L), lipopolysaccharide-injected (LPS) and LPS- and leptin-injected (LPS/L) groups, collected before (white bars) and after LPS/leptin/saline treatments (dark bars). Significant differences at p < 0.05, were indicated by: *—for treatment effect within the groups (repeated measures ANOVA—Sidak’s post hoc test) and by different letters for the photoperiod and treatments effects calculated separately for data before treatments (abcd—lowercase letters) and after treatments (ABCD—uppercase letters) by LPS/leptin (two-way ANOVA-Tukey’s post hoc test).

