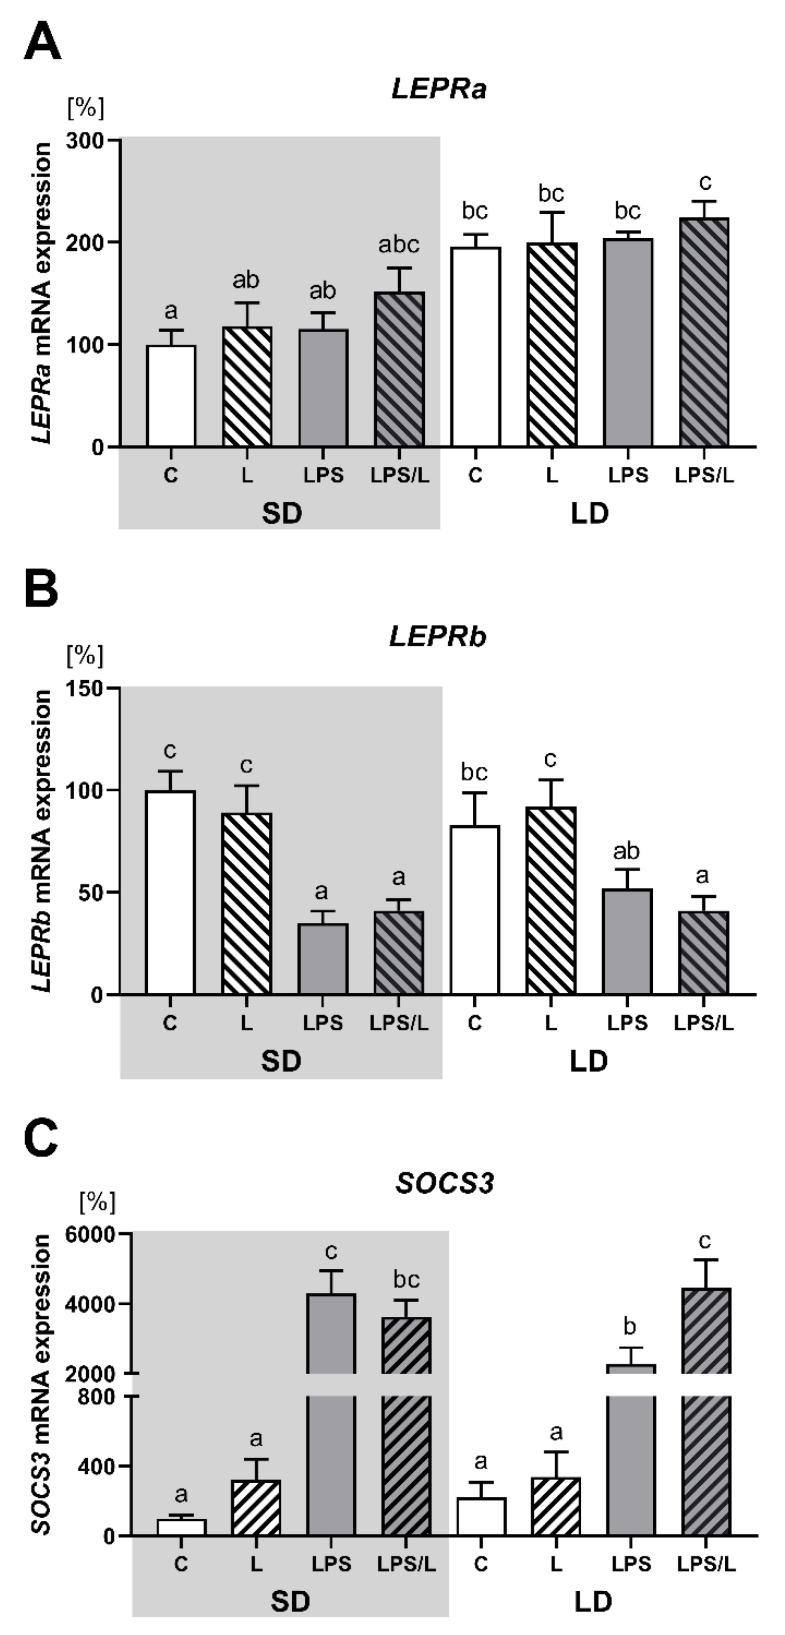
Figure 2.
Mean (±SEM) mRNA expression of LEPRa (A), LEPRb (B) and SOCS3 (C) in the ovine choroid plexus of saline (C, control—white bars), saline–leptin (L, white hatched bars), LPS (grey bars) and LPS–leptin (LPS/L, grey hatched bars) treated ewes during the short-day (SD, dark background) and the long-day (LD, light background) photoperiods. Different lowercase letters indicate significant differences between all groups at p < 0.05 (two-way ANOVA—Tukey’s post hoc test). The results are presented as percentage values (%), where the SD C group is considered as 100%.

