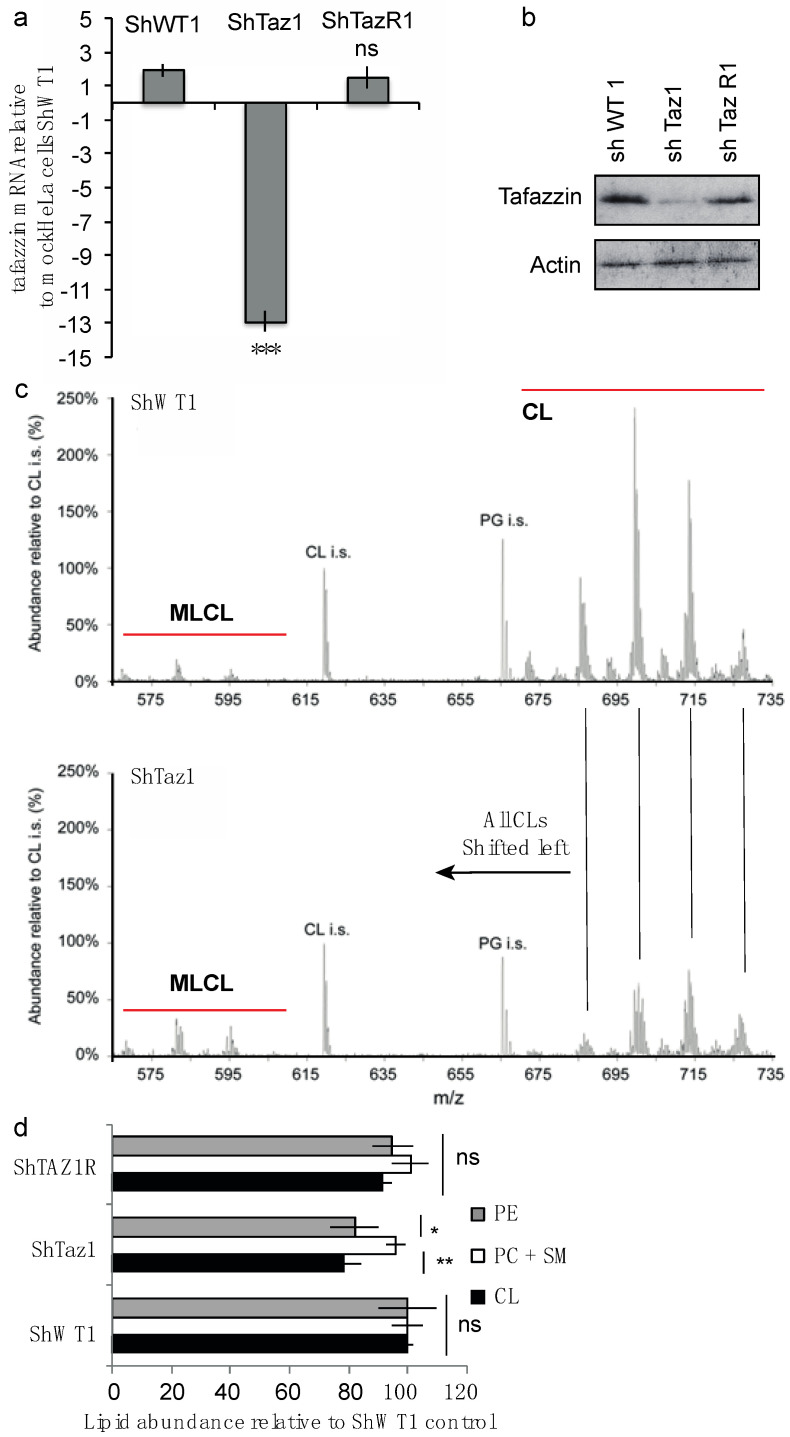
Figure 1.
General biochemical characterization of the different cell lines (ShWT1; control, ShTaz1; Tafazzin knockdown and ShTazR1; Tafazzin revertant). (a) Measurement of tafazzin mRNA for each cell line (ShWT1, ShTaz1, and ShTazR1) relative to mock HeLa cells as control. Data show mean of 5 independent preparations ± SEM. For comparison one t test was performed. ns = no significant and *** is the p-value ≤ 0.001. (b) Western blot analysis of tafazzin in the ShWT1, ShTaz1, and ShTazR1 cells. (c) Lipid extracts from control and tafazzin knockdown HeLa cells were analyzed for the overall levels of CL, PE and PC together with sphingomyelin (PC + SM). (d) Lipid abundance relative to ShWT1 control? For comparison one t-test was performed. ns = no significant and * is the p-value ≤ 0.05 and ** is the p-value ≤ 0.01.

