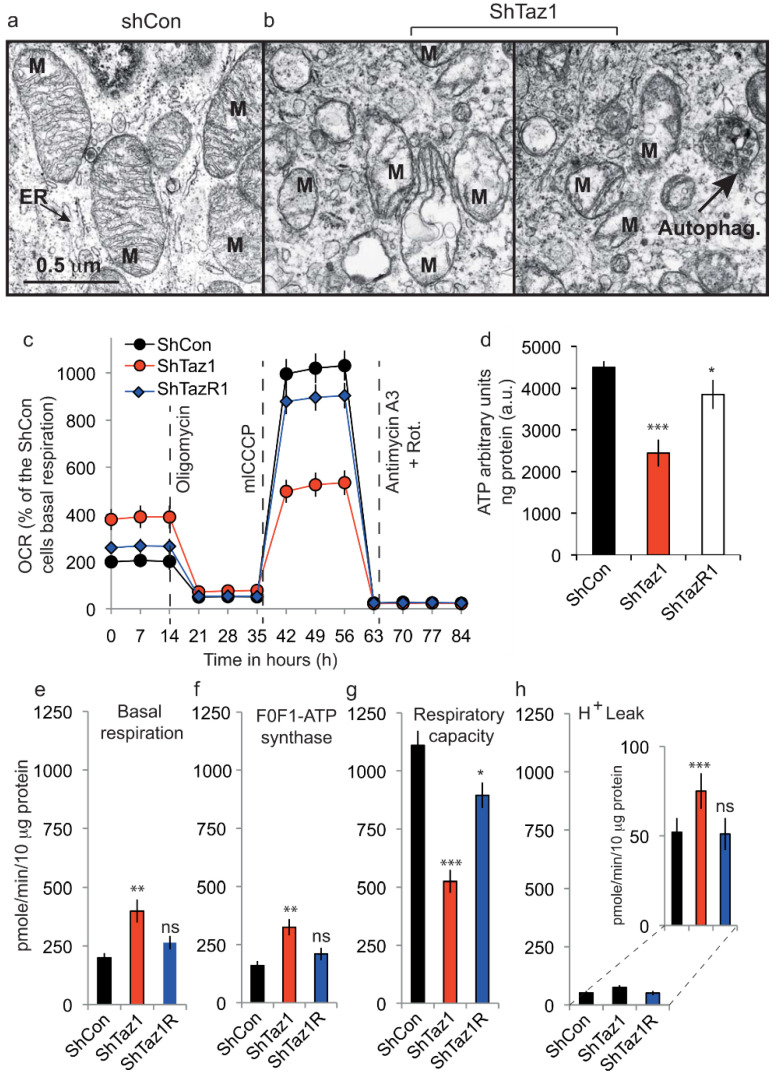
Figure 5.
Quantitation of mitochondrial functional parameters; electron microscopy and respiratory activity. (a,b) Electron microscopy of the ShWT1 and ShTaz1 cells. Left panel, ShWT1 (a) and ShTaz1 (b, the middle and right panel). In b, two electron microscopy pictures of the different types of mitochondria found for the ShTaz1 cells (middle and left panel). ER; Endoplasmic reticulum, M: Mitochondria; Autoph (indicated by the black arrow), autophagosomes enclosing part of the cytoplasm. (c) Analysis of the mitochondrial oxygen consumption rate (OCR) for the three cell lines in response to successive treatments with oligomycin (Oligo, 0.5 μM, an ATP synthase inhibitor), mClCCP (an uncoupler, 0.5 μM) and antimycin + rotenone (Rot) (0.5 μM, complex III inhibitor and for Rot 1 μM) with a Seahorse device XF24 flux analyzer. (e) Deduced by calculations from (d) Histogram representation of basal respiration. (f) Deduced by calculations from (d) Histogram representation of F0F1ATP synthase activity. (g) Deduced by calculations from (d) Histogram representation of maximal respiration capacity (h) Deduced by calculations from (d) Histogram representation of the proton leak (H+ leak). Since the H+ leak is small, there is an enlarged representation on another scale on the left of the primary histogram. In (e–h), the activities are always measured in pmol/min/10 μg protein. ns = no significant and * is the p-value ≤ 0.05 and ** is the p-value ≤ 0.01 and *** is the p-value ≤ 0.001.

